
While Street Earnings (based on Zacks Earnings) overstate profits for the majority of S&P 500 companies, as shown in Street Earnings Overstated for Most S&P 500 Companies in 2021, there are also many S&P 500 companies whose Street Earnings understate their true profits. These companies are more profitable than investors realize and, in most cases, undervalued as well.
This report shows:
- the prevalence and magnitude of understated Street Earnings in the S&P 500
- why Street Earnings (and GAAP earnings) are flawed
- five S&P 500 companies with understated Street Earnings and Very Attractive Stock Ratings
- how Core Earnings[1] and our Earnings Distortion factor provide a new source of alpha.
Over 150 S&P 500 Firms Have Understated Street Earnings
For 155 companies in the S&P 500, Street Earnings understated Core Earnings[2] for the trailing-twelve-months (TTM) ended calendar 2021. In the TTMs ended 3Q21 and 4Q20, 135 and 139 companies understated their earnings, respectively. When Street Earnings understate Core Earnings, they do so by an average of -12% per company, per Figure 1. Street Earnings understate Core Earnings by >10% for ~9% of S&P 500 companies.
Figure 1: Street Earnings Understated by -12% on Average in 2021[3]

Sources: New Constructs, LLC and company filings.
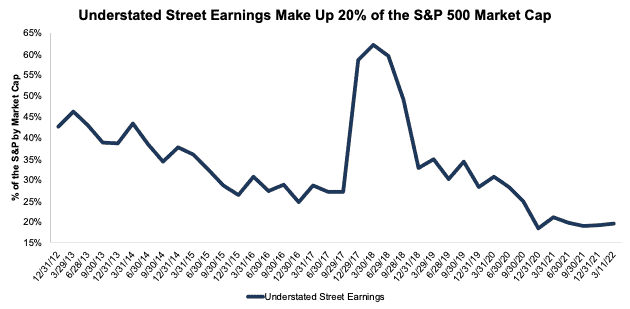
The 155 companies with understated Street Earnings represent 20% of the market cap of the S&P 500 as of 3/11/22, which is the fourth-lowest percent since 2012 (earliest data available), measured with TTM data in each quarter. Figure 2 shows that roughly 20%, by market cap, of the S&P 500 has understated earnings for most of the last two years.
Figure 2: Understated Street Earnings as % of Market Cap: 2012 through 3/11/22
Sources: New Constructs, LLC and company filings.
The Five Most Understated Earnings in the S&P 500
Companies that understate earnings are more rare than in years past, but you can find them if you know where to look.
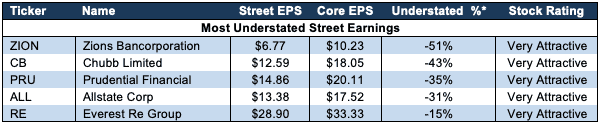
Figure 3 shows five S&P 500 stocks with Very Attractive Stock Ratings and the most understated Street Earnings (based on Street Distortion as a % of Street Earnings per share) in 2021. “Street Distortion” equals the difference between Core Earnings per share and Street Earnings per share. Investors using Street Earnings miss the true profitability of these businesses.
Figure 3: S&P 500 Companies with Most Understated Street Earnings: 2021
Sources: New Constructs, LLC and company filings.
*Measured as Street Distortion as a percent of Street EPS
In the section below, we detail the hidden and reported unusual items that distort GAAP Earnings for Allstate (ALL). All these unusual items are removed from Core Earnings.
Allstate’s (ALL) 2021 Street Earnings Understated by $4.14/share
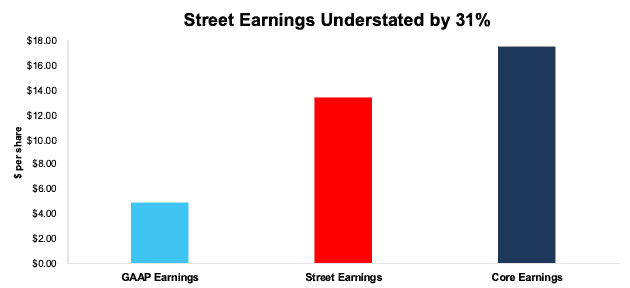
The difference between Allstate’s Street Earnings ($13.38/share) and Core Earnings ($17.52/share), is $4.14/share, per Figure 4. We call that difference “Street Distortion,” which equals 31% of Street Earnings.
Allstate’s GAAP Earnings ($4.96/share) understate Core Earnings by $12.56/share. Street Earnings are less distorted by unusual items than GAAP Earnings for Allstate, but they still miss many key items we catch when calculating Core Earnings.
Figure 4: Comparing Allstate’s GAAP, Street, and Core Earnings: 2021
Sources: New Constructs, LLC and company filings.
Below, we detail the differences between Core Earnings and GAAP Earnings so readers can audit our research. We would be happy to reconcile our Core Earnings with Street Earnings but cannot because we do not have the details on how analysts calculate their Street Earnings.
Allstate’s Earnings Distortion Score is Beat and its Stock Rating is Very Attractive, in part due to its top-quintile return on invested capital (ROIC) and price-to-economic book value (PEBV) ratio of 0.5. Allstate has an economic book value (EBV), or no growth value, of $286/share – a 105% upside from the current price.
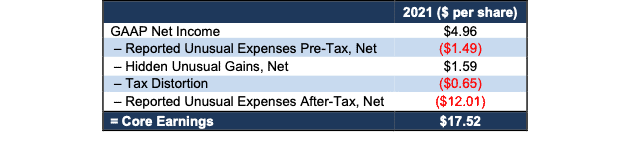
Figure 5 details the differences between Allstate’s Core Earnings and GAAP Earnings.
Figure 5: Allstate’s GAAP Earnings to Core Earnings Reconciliation: 2021
Sources: New Constructs, LLC and company filings.
More details:
Total Earnings Distortion of $12.56/share, which equals $3.8 billion, is comprised of the following:
Reported Unusual Expenses Pre-Tax, Net = -$1.49/per share, which equals -$445 million and is comprised of
- -$890 million contra adjustment for recurring pension costs. These recurring expenses are reported in non-recurring line items, so we add them back and exclude them from Earnings Distortion.
- -$170 million in restructuring and related charges
- -$29 million in Shelter-in-Place Payback expense
- $644 million in pension and other postretirement remeasurement gains
Hidden Unusual Gains, Net = $1.59/per share, which equals $477 million and is comprised of
- -$22 million in transaction costs related to acquisition of National General reported in operating costs and expenses – Page 114
- $499 million gain on valuation change of equity investments – Page 121
Tax Distortion = -$0.65/per share, which equals $195 million
Reported Unusual Expenses After-Tax, Net = -$12.01/per share, which equals -$3.6 billion and is comprised of
- -$3.6 billion loss from discontinued operations, net of tax
The gap between Street Earnings and GAAP Earnings for Allstate indicates that Street Earnings account for some of the unusual items in GAAP Earnings. However, the $4.14/share Street Distortion highlights that Core Earnings includes a more comprehensive set of unusual items when calculating Allstate’s true profitability.
This article originally published on April 5, 2022.
Disclosure: David Trainer, Kyle Guske II, and Matt Shuler receive no compensation to write about any specific stock, style, or theme.
Follow us on Twitter, Facebook, LinkedIn, and StockTwits for real-time alerts on all our research.
[1] The Journal of Financial Economics features the superiority of our Core Earnings in Core Earnings: New Data & Evidence.
[2] Our Core Earnings research is based on the latest audited financial data, which is the calendar 2021 10-K in most cases. Price
[3] Average understated % is calculated as Street Distortion, which is the difference between Street Earnings and Core Earnings.