
Quarterly earnings season may be winding down, but the real earnings season – annual 10-K filing season – is ramping up. Investors ignoring filings, footnotes, and the MD&A are in the Danger Zone.
Why Footnotes Matter – Earnings Are More Overstated Than Any Time Since 2012
Going into the 4Q21 calendar earnings season, Street Earnings were more overstated than any time since 2012. Specifically, the 360 S&P 500 companies that overstated Street Earnings in 3Q21 make up 81% of the market cap of the index, the highest percentage since at least 2012 (earliest data available).
Figure 1: Overstated Street Earnings as % of Market Cap: 2012 through 11/16/21
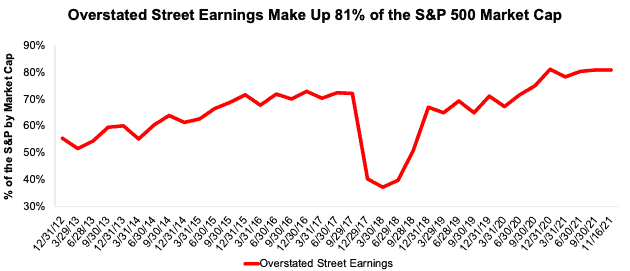
Sources: New Constructs, LLC and company filings.
Since 2005, we’ve reported how traditional earnings measures are unreliable due to accounting loopholes that allow companies to manage earnings. Our Core Earnings[1] excludes unusual gains and losses to provide a more reliable earnings measure shown to provide a new source of alpha.
The only way to overcome the flaws in Street Earnings, GAAP earnings, and other profit metrics from legacy providers is through rigorous analysis of company filings, especially the footnotes and MD&A[2].
In this report, we provide an example of an unusual item that has a material impact on Amazon (AMZN) and Ford’s (F) 2021 GAAP Earnings. We also highlight a well-known tech company with highly misleading Street and GAAP earnings.
IPO Euphoria Impacts 2021 Reported Earnings for Amazon (AMZN) and Ford (F)
Despite lackluster price performance since its IPO in November 2021, Rivian’s (RIVN) IPO had a material impact on the reported profits of both Amazon and Ford in 2021. Amazon and Ford formed “strategic” partnerships with Rivian prior to its IPO, which we called “arms-length equity investments” in our original report on Rivian.
Reported 2021 earnings confirmed our views on these partnerships and significantly boosted both firm’s reported earnings.
In 2021, Amazon reported GAAP Earnings of $33.4 billion, or $64.78/share. However, included in earnings was $14.6 billion, or $28.41/share in “Other Income” reported on the income statement. Only by reading the footnotes can investors find that $11.8 billion, or $22.91/share, of “Other Income” is actually a valuation gain from the equity investment in Rivian Automotive.
When we adjust for all unusual items in Amazon’s 10-K (details available to all New Constructs members), we find that Amazon’s 2021 Core Earnings are $20.1 billion, or $39.05/share, which is significantly (40%) lower than reported GAAP earnings of $33.4 billion, or $64.78/share.
Ford’s 2021 results present a similar story. In 2021, Ford reported GAAP Earnings of $17.9 billion, or $4.45/share. However, included in earnings was $9.2 billion, or $2.27/share in realized and unrealized gains on cash equivalents, marketable securities, and other investments. We find that $9.1 billion, or $2.25/share of these reported gains are directly related to gains on Rivian’s IPO, information that was only disclosed in the management discussion and analysis section of Ford’s 2021 10-K.
When we adjust for all unusual items in Ford’s 10-K (details available to all New Constructs members), we find that Ford’s 2021 Core Earnings are $8.9 billion, or $2.20/share, which is significantly (51%) lower than reported GAAP earnings of $17.9 billion, or $4.45/share.
These highly overstated earnings mean both Amazon and Ford now earn a Strong Miss Earnings Distortion Score. Without proper diligence of reading the footnotes and MD&A, investors would believe both Amazon and Ford were significantly more profitable in 2021 than they really were.
Block (SQ): Street Earnings Overstated by $1.45/share & GAAP Earnings Overstated by $0.72/share
Of the S&P 500 companies that haven’t yet filed their 10-K and earn an Unattractive-or-worse rating, Block (SQ) has some of the most overstated earnings. Overstated earnings earn Block our Strong Miss Earnings Distortion Score. Our stock rating for SQ is Very Unattractive.
The difference between Block’s 3Q21 Street Earnings of $1.76/share and Core Earnings of $0.31/share is $1.45/share, per Figure 2.
Below, we detail the hidden and reported unusual items that aren’t captured in GAAP Earnings but are captured in Core Earnings for Block. We would be happy to reconcile our Core Earnings with Street Earnings but cannot because we do not have the details on how analysts calculate their Street Earnings.
Unusual gains, which we detail below, materially increased Block’s 3Q21 TTM GAAP Earnings and make profits look better than Core EPS. After adjusting for unusual items, we find that Block’s Core Earnings of $0.31/share are less than one-third of reported GAAP Earnings of $1.03/share.
Figure 2: Comparing Block’s Street, GAAP, and Core Earnings: TTM as of 3Q21
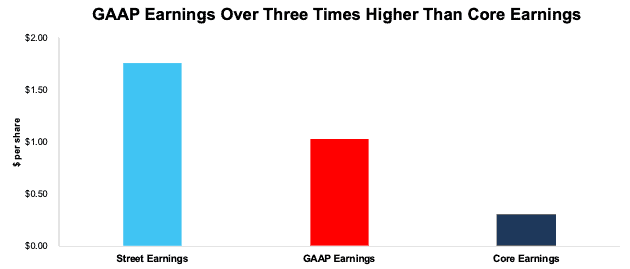
Sources: New Constructs, LLC and company filings.
Below, we detail the differences between Core Earnings and GAAP Earnings so readers can audit our research. Figure 3 details the differences between Block’s Core Earnings and GAAP Earnings.
Figure 3: Block’s GAAP Earnings to Core Earnings Reconciliation: 3Q21

Sources: New Constructs, LLC and company filings.
Total Earnings Distortion of $0.72/share, which equals $375 million, is comprised of the following:
Hidden Unusual Gains, Net = $0.54/per share, which equals $281 million and is comprised of
- $295 million in the TTM period based on $295 million in gains on revaluation of equity investments in the 2020 10-K
- $5 million in sublease income in the TTM period based on
- $2.6 million in 1Q21
- $2.6 million in 4Q20
- -$3 million in losses on disposal of property and equipment in the TTM period based on
- -$0.9 million in 3Q21
- -$0.4 million in 2Q21
- -$0.6 million in 1Q21
- -$0.6 million in 4Q20
- -$17 million in acquisition related costs in the TTM period based on
- -$0.3 million in 3Q21
- -$14 million in 2Q21
- -$0.03 million in 1Q21
- -$2 million in 4Q20
Reported Unusual Gains Pre-Tax, Net = $0.17/per share, which equals $89 million and is comprised of
- $307 million in “Other Income” in the TTM period based on
- -$12 million in expense in 3Q21
- $76 million in income in 2Q21
- -$28 million in expense in 1Q21
- $271 million in income in 4Q20
- -$71 million in bitcoin impairment losses in the TTM period based on
- -$6 million in 3Q21
- -$45 million in 2Q21
- -$20 million in 1Q21
- -$147 million in transaction and loan losses in the TTM period based on
- -$62 million in 3Q21
- -$48 million in 2Q21
- -$20 million in 1Q21
- -$16 million in 4Q20
Tax Distortion = $0.01/per share, which equals $4 million
Clearly, getting to the truth about Block’s profitability requires going beyond the income statement and balance sheet. We do that work for nearly all U.S. exchange-traded companies.
Technology to Provide Reliable Research at Scale
For humans, performing this level of due diligence (i.e. analyzing filings & footnotes) on just a few companies is a daunting task. Applying this level of rigor to thousands of companies is downright impossible – until now.
We use our cutting-edge Robo-Analyst technology to help automate the analysis of corporate filings. From mid-February through the end of March, our expert team of human analysts will be coming in early and staying late to validate the models built by the Robo-Analyst.
Last year, from February 19, 2021 through March 29, 2021, we analyzed 1,914[3] 10-K and 10-Q filings from which our Robo-Analyst[4] technology collected 219,465 data points. Our analyst team used this data to make 35,498 Core Earnings, balance sheet, and valuation adjustments with a dollar value of $18 trillion.
Figure 4: Filing Season 2021 – The Power of the Robo-Analyst

Sources: New Constructs, LLC and company filings.
The adjustments were applied as follows:
- 13,255 income statement adjustments with a total value of $1.2 trillion
- 14,541 balance sheet adjustments with a total value of $7.5 trillion
- 7,702 valuation adjustments with a total value of $9.7 trillion
This combination of technology and human expertise enables investors to overcome the flaws in legacy fundamental research and make more informed investment decisions. Look for our Filing Season Finds Reports over the coming weeks, which will feature items found during the real earnings season.
Check out this week’s Danger Zone interview with Chuck Jaffe of Money Life.
This article originally published on February 14, 2022.
Disclosure: David Trainer, and Kyle Guske II, and Matt Shuler receive no compensation to write about any specific stock, sector, style, or theme.
Follow us on Twitter (#filingseasonfinds), Facebook, LinkedIn, and StockTwits for real-time alerts on all our research.
[1] Only Core Earnings enable investors to overcome the flaws in legacy fundamental data and research, as proven in Core Earnings: New Data & Evidence, written by professors at Harvard Business School (HBS) & MIT Sloan for The Journal of Financial Economics.
[2] Only our “novel database” enables investors to overcome flaws with legacy fundamental datasets and apply reliable fundamental data that analyzes all the footnotes & MD&A in their research.
[3] We analyzed the majority of those filings (1,769) by March 17th.
[4] Harvard Business School features the powerful impact of our research automation technology in the case New Constructs: Disrupting Fundamental Analysis with Robo-Analysts.