
Check out this week’s Danger Zone interview with Chuck Jaffe of Money Life.
HSBC Opportunity Fund (HSOAX, HOPBX, HOPCX) is a Mid Cap Growth fund investors should avoid. The managers’ process for picking stocks relies on flawed metrics, such as earnings growth. Research into the fund’s holdings[1] reveals stocks with poor risk/reward compared to the benchmark. Add in the fact that it charges above average fees, and it is clear why this fund lands in the Danger Zone.
Traditional Research Overrates this Fund
Per Figure 1, HSOAX, HOPBX, and HOPBC receive a 3-Star rating from Morningstar. When viewed through our Predictive Risk/Reward Fund Rating methodology, all three classes earn an Unattractive-or-worse rating, with HSOAX earning a Very Unattractive rating.
Figure 1: HSBC Opportunity Fund Ratings

Sources: New Constructs, LLC and company filings
Holdings Quality Research Reveals Flaws
The only justification for a mutual fund to charge higher fees than its ETF benchmark is “active” management that leads to out-performance. A fund is most likely to outperform if it has higher quality holdings than its benchmark. To make this determination on holdings quality, we leverage our Robo-Analyst technology[2] to drill down and analyze the individual stocks in every fund we cover.
Figure 2: HSBC Opportunity Fund Asset Allocation vs. Benchmark
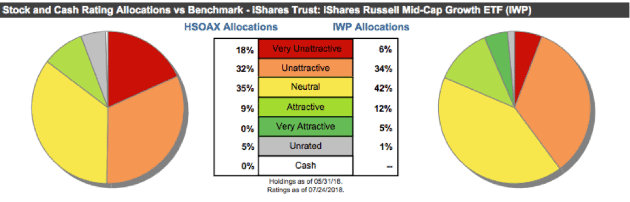
Sources: New Constructs, LLC and company filings
Per Figure 2, HSBC Opportunity Fund’s asset allocation poses greater downside risk than its benchmark, iShares Russell Mid Cap Growth ETF (IWP). HSOAX allocates only 9% of its portfolio to Attractive-or-better rated stocks compared to 17% for IWP. HSOAX allocates three times as much to Very Unattractive stocks (18%) than IWP (6%). Overall, exposure to Unattractive-or-worse rated stocks is much higher for HSOAX (50% of portfolio) than for IWP (40% of portfolio).
Seven of the mutual fund’s top 10 holdings receive an Unattractive-or-worse rating and make up 15% of its portfolio. In total, nine of the top 10 holdings receive a Neutral-or-worse rating and make up 19% of HSOAX’s portfolio.
Given the unfavorable allocation of Very Attractive vs. Very Unattractive stocks relative to the benchmark, HSBC Opportunity Fund appears poorly positioned to generate the outperformance required to justify its fees.
Fund Managers Fail to Find Quality Stocks
The managers of HSOAX seek to “invest in companies with consistent or accelerating earnings growth” and select securities based on “analysis of a company’s cash flow, industry position, potential for high profit margins, and strength of management.” More important than all other factors, the managers consider “earnings growth to be the most integral to its stock selection process.”
As we have shown empirically, earnings growth has little correlation with creating shareholder value. Worse yet, the fundamental metrics the fund uses to select stocks have not led it quality stocks. In fact, the fund has allocated to stocks less profitable and more expensive than the S&P 500 and its benchmark.
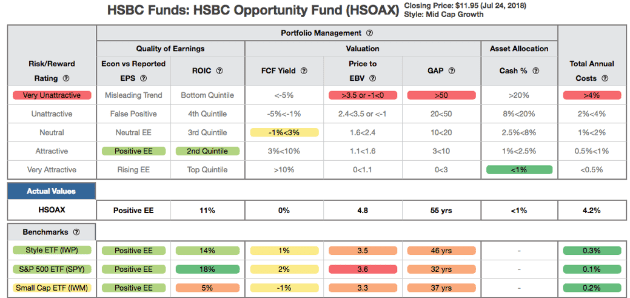
Figure 3 contains our detailed rating for HSOAX, which includes each of the criteria we use to rate all funds under coverage and shows the fund’s poor portfolio management. These criteria are the same for our Stock Rating Methodology, because the performance of a fund’s holdings equals the performance of a fund after fees.
Figure 3: HSBC Opportunity Fund (HSOAX) Rating Breakdown
Sources: New Constructs, LLC and company filings
As Figure 3 shows, HSOAX’s holdings are worse than IWP and SPY in four of the five criteria that make up our holdings analysis. Specifically:
- The return on invested capital (ROIC) for HSOAX’s holdings is 11%, which is below the 14% earned by companies held by IWP and the 18% earned by SPY holdings.
- The 0% free cash flow yield of HSOAX’s holdings is less than the 1% earned by IWP stocks and the 2% earned by SPY stocks.
- The price-to-economic book value (PEBV) ratio for HSOAX is 4.8 compared to 3.5 for IWP and 3.6 for SPY.
- Our discounted cash flow analysis reveals an average market-implied growth appreciation period (GAP) of 55 years for HSOAX holdings compared to 46 years for IWP and 32 years for SPY.
This analysis reveals that, ultimately, the companies held by HSOAX earn inferior cash flows (as measured by ROIC) but are valued at a premium (as measured by FCF yield, PEBV, and GAP) when compared to the benchmark and general market (S&P 500).
Wex Inc. (WEX) is one of HSOAX’s top holdings and earns a Very Unattractive rating. Since 2012, WEX’s economic earnings have fallen from $105 million to -$108 million over the last twelve months. Over the same time, its ROIC fell from 16% to 4% and its NOPAT margin declined from 27% to 13%. Despite the deterioration in fundamentals, shares remain significantly overvalued.
To justify its current price of $196/share, WEX must achieve 18% margins (vs 13% TTM) and grow NOPAT by 18% compounded annually for the next 10 years. See the math behind this dynamic DCF scenario. This scenario seems unlikely given WEX’s declining margins and shareholder destruction since 2012.
Even if we assume WEX can achieve an 18% NOPAT margin and grow NOPAT by 13% compounded annually for the next decade, the stock is worth only $108/share today – a 45% downside. See the math behind this dynamic DCF scenario.
Excessive Fees Make the Fund Even More Risky
At 4.19%, HSOAX’s total annual costs (TAC) are higher than 99% of the 345 Mid Cap Growth style funds under coverage. For comparison, the average TAC of all Mid Cap Growth mutual funds under coverage is 1.75%, the weighted average is 1.56%, and the benchmark ETF (IWP) has total annual costs of 0.28%.
Per Figure 4, HSBC Opportunity Fund’s expense ratios understate the true costs of investing in this fund. Our TAC metric accounts for more than just expense ratios. We consider the impact of front-end loads, back-end loads, redemption fees, and transaction costs.
Figure 4: HSBC Opportunity Fund’s Real Costs

Sources: New Constructs, LLC and company filings
To justify its higher fees, each class of the fund must outperform its benchmark by the following over three years:
- HSOAX must outperform by an average of 3.90% annually.
- HOPBX must outperform by an average of 3.40% annually.
- HOPCX must outperform by an average of 2.83% annually.
HSOAX, the most expensive class, charges a 1.9% front-end load. While a front-end load may seem like a one-time cost, it actually reduces the long-term returns of the fund as well. An in-depth analysis of HSOAX’s TAC is on page 2 here.
Recent Outperformance Looks Unlikely to Continue
Over the past year, HSOAX has outperformed (as measured by growth of $10K) its benchmark and the overall market (S&P 500). However, long-term, HSOAX has underperformed over the three, five, and ten-year periods and has failed to surpassed the 3.90% per year required to justify its higher fees. Figure 5 has more details.
Figure 5: HSBC Opportunity Fund vs. IWP & SPY: Growth of 10K

Sources: New Constructs, LLC and company filings.
Given that 50% of assets are allocated to stocks with Unattractive-or-worse ratings, HSOAX looks likely to underperform moving forward.
The Importance of Holdings Based Fund Analysis
The analysis above shows that HSOAX is just one of the many Unattractive Mid Cap Growth funds that drive an Unattractive rating for the entire group. More details can be found in our 3Q18 Style Ratings for ETFs & Mutual Funds report. With so many ETFs and mutual funds in the style (345), picking the right one can be difficult. Smart fund investing means analyzing the holdings of each fund, which is impossible for the average investor to perform.
Our machine learning and Robo-Analyst technology helps investors navigate this investment style by sifting through the holdings of all 345 Mid Cap Growth ETFs and mutual funds. This diligence allows us to identify potentially dangerous funds that traditional backward-looking fund research may overlook.
Each quarter we rank the 11 sectors in our Sector Ratings for ETF & Mutual Funds and the 12 investment styles in our Style Ratings For ETFs & Mutual Funds report. This analysis allows us to find funds that investors using traditional fund research may view as quality investments while deeper analysis reveals otherwise, such as HSBC Opportunity Fund. Rather than putting money into HSOAX, investors would be better suited with one of the 22 Attractive-or-better rated ETFs and mutual funds in the Mid Cap Growth style.
This article originally published on July 30, 2018.
Disclosure: David Trainer, Kyle Guske II, and Sam McBride receive no compensation to write about any specific stock, sector, style, or theme.
Follow us on Twitter, Facebook, LinkedIn, and StockTwits for real-time alerts on all our research.
[1] Ernst & Young’s recent white paper, “Getting ROIC Right”, proves the superiority of our holdings research and analytics.
[2] Harvard Business School features the powerful impact of our research automation technology in the case study New Constructs: Disrupting Fundamental Analysis with Robo-Analysts.