
For the best financial analysis ratios, look no further. Harvard Business School and MIT Sloan empirically demonstrate the superiority of the data that drives our models and calculations. This paper compares our financial analysis to Bloomberg and Capital IQ (see appendix for details).
We’ve pointed out the flaws in the price to earnings (PE) ratio many times before. Chief among these flaws is the fact that the accounting earnings used in the ratio are unreliable for many reasons:
- Accounting rules can change, shifting reported earnings without any real change in the underlying business.
- The large number of accounting loopholes makes it easy for executives to mislead investors.
- PE ratios overlook assets and liabilities that have a material impact on valuation.
It should come as no surprise that empirical research shows accounting earnings have almost no impact on long-term valuations.
No Correlation Between Earnings And Value
If accounting earnings actually drove valuations, then companies with high EPS growth should command higher multiples, and companies with low or negative EPS growth should have lower PE multiples. As Figure 1 shows, this correlation is nearly nonexistent.
Figure 1: EPS Growth Has Almost No Impact On Valuation
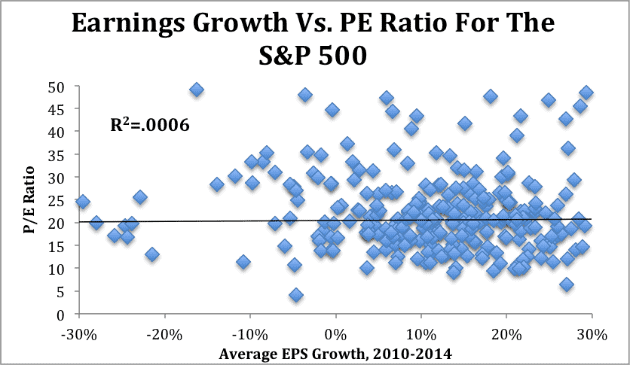
Sources: New Constructs, LLC and company filings.
The r-squared value of 0.0006 in Figure 1 shows that EPS growth over the past five years explains less than one tenth of one percent of the difference in price between stocks in the S&P 500. Stocks can see their PE multiples expand and contract in a manner that has almost nothing to do with changes in EPS, which makes looking at these metrics a poor indicator of valuation or future returns.
The Market Cares More About ROIC
Many other studies have found the same lack of correlation between earnings growth and stock price. Instead, we find that valuations tend to be driven largely by return on invested capital (ROIC). Figure 2 shows that ROIC is highly correlated with Enterprise Value/Invested Capital (a cleaner version of price to book).
Figure 2: ROIC Is The Primary Driver Of Stock Price
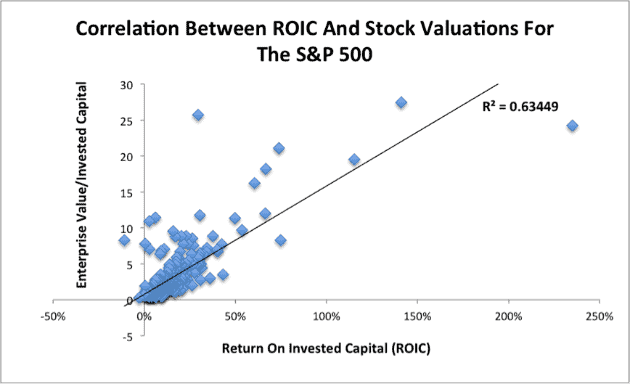
Sources: New Constructs, LLC and company filings.
ROIC explains nearly two thirds of the difference in valuations between various companies. That means companies that can improve their ROIC are more likely to grow their stock price in the market.
Short Term Vs. Long Term Drivers
“But wait!” you might be saying. “I know accounting earnings have an impact on valuations. I’ve seen stock prices rise and fall dramatically based on a company’s quarterly earnings report.”
This is true. It’s clear that headline numbers can have an immediate and sometimes dramatic influence on stock prices. The key word in that sentence is “immediate”. A big increase in EPS might drive short-term gains in stock prices, but it won’t create long-term value. To understand the cause of this divergence, you have to understand the different types of investors in the market.
Brian Bushee from the Wharton School of Business wrote an excellent paper back in 2005 that highlighted the behavioral differences among institutional investors. His research found that:
- 61% of institutional investors are “Quasi-Indexers”. They hold many small stakes with low turnover, so they have little impact on market valuations.
- 31% of institutional investors are “Transients”. They have small stakes but a high turnover, so their high volume of trading can impact valuations in the short term.
- 8% of institutional investors are “Dedicated”. They take large stakes and hold them for a very long time. These are the investors that drive long-term valuations.
A big earnings beat might cause a lot of “Transient” investors to buy that stock, pushing up the price, but most of these investors will sell their stakes not long after, pushing the price back down. They can create spikes, but their impact on the long-term performance of the stock is next to nothing.
Instead, it’s that small percentage of “Dedicated” investors that are responsible for the majority of long-term performance. These are highly sophisticated individuals that take a long time evaluating stocks before taking large positions that they hold through bouts of volatility.
Why You Have To Look At The Balance Sheet And Cost Of Capital
The central flaw of the PE ratio holds true for many of the other common ratios such as:
- Enterprise Value/EBITDA
- Price to Earnings Growth (PEG)
- Price to Operating Cash Flow
- Price to Sales
All of these ratios ignore the cost of the capital that the company uses to drive profits.
To understand why cost of capital is so important, imagine this hypothetical scenario: you have an infinitely wealthy investor who is willing to offer you an unlimited source of equity capital. You take the money from this investor and put it in a low-yielding savings account. The more money you take from this investor, the more your interest payments, or “earnings”, will grow, but you’re not actually creating any value. In fact, by earning such a low return on that money compared to what they could earn elsewhere, you’ve actually destroyed value.
The use of these flawed metrics perpetuates the irrelevant distinction between growth and value investing. Earnings growth without an ROIC above the weighted average cost of capital (WACC) destroys value, and value without growth limits upside. While ROIC is, by far, the most important driver of value, it is not the only factor. One must also consider revenue growth and duration of profit growth, i.e. growth appreciation period (GAP). These three drivers (as explained here) comprise everything that defines the profitability and, therefore value, of a company. PE and PEG are driven by these drivers, not the other way around.
The same concept applies to companies that grow EPS by deploying capital at suboptimal rates of return. As we discussed in “The High-Low Fallacy”, an acquisition can be accretive to earnings but destructive to shareholder value. Recent Danger Zone pick Expedia (EXPE) has managed significant EPS growth through $3.2 billion in acquisitions, but these acquisitions have actually hurt the long-term interests of shareholders by earning an ROIC that falls short of WACC.
For that reason, investors need to be looking at ROIC rather than EPS, and they need to recognize that a PE multiple tells you next to nothing about the actual value of a stock.
Disclosure: David Trainer and Sam McBride receive no compensation to write about any specific stock, sector, style, or theme.
Click here to download a PDF of this report.
Photo Credit:Barbara Krawcowicz (Flickr)
2 replies to "Why PE Ratios Are Not A Good Measure Of Value"
Thank you for a deep-dive overlook! I’m wondering, what’s the formula for GAP calculation? Didn’t find it in your another article covering GAP. Thank you!
Market-implied GAP is calculated based off our DCF model. We calculate GAP based on the number of years the company would have to grow using consensus forecasts. Here’s a more in-depth explanation of our DCF:
https://www.newconstructs.com/education-close-the-loopholes-how-our-dcf-works/