

As Ben Hogan said:
“Golf is not a game of good shots. It’s a game of bad shots.”
Just one bad stock can ruin your portfolio, and that fact is precisely why doing proper diligence, and calculating an accurate measure of earnings, is so important.
Where Can You Find True Earnings?
Start with the Bloomberg New Constructs Core Earnings Leaders Index (BCORET:IND). This index holds stocks where deep diligence reveals businesses that are more profitable than the market realizes, i.e. Core Earnings[1] are higher than GAAP earnings. It beats the S&P 500 over the past year and five years. More details on index construction are here.
The alpha in the strategy above is possible only if you have access to the true Core Earnings of all companies in the Bloomberg 1000. Getting Core Earnings on that many companies requires a lot of work, more than humans can do. By work, we mean reading millions of pages of financial filings, particularly the footnotes, to remove non-operating and non-recurring items to calculate true Core Earnings.
Wall Street can’t, or won’t, do this work, because it’s easier to calculate adjusted “EBITDA” or other metrics that help sell IPOs.
But, we do the work, and we have the alpha to prove it.
Avoid the Portfolio Traps
The index not only finds quality companies, but also avoids companies that are less profitable than the market realizes, i.e. Core Earnings are lower than GAAP earnings.
Below we detail one company that was recently dropped from the index when it rebalanced on July 17, 2026 because its Core Earnings no longer exceed GAAP earnings.
NXP Semiconductors N.V. (NXPI): Less Profitable Than You Know
NXP Semiconductors (NXPI: $231/share) lost its spot in the Bloomberg New Constructs Core Earnings Leaders Index as the company’s Core Earnings fell while GAAP earnings grew in the TTM ended 1Q26 (latest filing available when the index rebalanced).
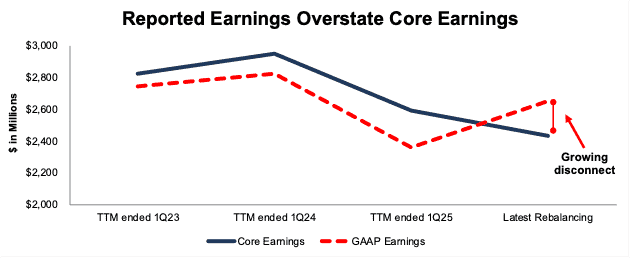
NXP Semiconductors’ Core Earnings fell 6% year-over-year (YoY), from $2.6 billion in the TTM ended 1Q25 to $2.4 billion as of July 16th, the day before the index’s rebalance date. GAAP earnings improved 12% over the same time, from $2.4 billion to $2.7 billion. See Figure 1.
Figure 1: NXP Semiconductors’ Core vs. GAAP Earnings: TTM ended 1Q23 – Latest Rebalancing
Sources: New Constructs, LLC and company filings
How We Reconcile NXP Semiconductors’ GAAP Earnings to Core Earnings
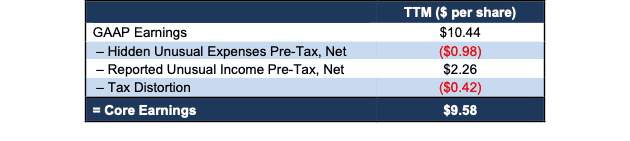
Figure 2 details the hidden and reported unusual items that distort NXP Semiconductors’ GAAP Earnings as of the latest rebalancing as a real-world example of the work we do for all companies we cover. We remove all of these unusual income and expense items from Core Earnings.
We provide these details so readers can audit our research and see the importance of reading 10-Ks and 10-Qs.
Figure 2 show the difference, what we call GAAP Earnings Distortion, between NXP Semiconductors’ Core Earnings and GAAP Earnings.
Figure 2: NXP Semiconductors’ GAAP to Core Earnings Reconciliation: As of Latest Rebalancing
Sources: New Constructs, LLC and company filings.
Details on Key Data Found in the Footnotes
The difference between GAAP ($10.44) and Core Earnings ($9.58) is $0.87/share, or $220 million, and is comprised of the following:
Hidden Unusual Expenses Pre-Tax, Net = -$0.98/share, which equals -$249 million and is comprised of:
- -$249 million in net restructuring charges in the TTM period based on
- -$2 million in 1Q26
- -$177 million in 4Q25
- -$3 million in 3Q25
- -$67 million in 2Q25
Reported Unusual Income Pre-Tax, Net = $2.26/share, which equals $575 million and is comprised of:
- $624 million in other income in the TTM period based on
- $621 million in 1Q26
- $4 million in 4Q25
- -$2 million in 3Q25
- $1 million in 2Q25
- $15 million contra adjustment for recurring pension costs. These recurring expenses are reported in non-recurring line items, so we add them back and exclude them from Earnings Distortion.
- -$64 million in other financial expenses and expenses from MSA and TSA arrangements in the TTM period based on
- -$13 million in 1Q26
- -$24 million in 4Q25
- -$17 million in 3Q25
- -$10 million in 2Q25
Tax Distortion = -$0.42/per share, which equals -$106 million
Given that the majority of GAAP Earnings Distortion listed above is reported, specifically $600+ million in other income, which NXP Semiconductors discloses is mainly a gain on sale recorded in other income, unknowing investors may assume Wall Street adjusts for these items accordingly.
However, NXPI receives 22 Buy or Overweight ratings and just 8 Hold or Sell ratings on Wall Street.
Without making these material adjustments and calculating Core Earnings, investors would not realize how overstated GAAP Earnings are.
Investors armed with Core Earnings see the true profitability of NXP Semiconductors. With this edge, we see that the company is less profitable than its GAAP earnings indicate, which is why it was removed from the Bloomberg New Constructs Core Earnings Leaders Index in the July 2026 rebalance.
NXP Semiconductors Is Likely to Miss Earnings and Expensive Too
NXP Semiconductors’ GAAP Earnings Distortion Score is Miss. Our GAAP Earnings Distortion scores provide a short-term predictor of the likelihood of a company to miss expectations in the next quarter based on how much unusual gains and losses cause earnings estimates to be over or understated.
While the company is profitable, as evidenced by the positive Core Earnings in Figure 1, it is less profitable than reported earnings indicate. Additionally, the expectations for future profit growth baked into the stock at its current price leave the stock with strong downside risk.
NXP Semiconductors has a price-to-economic book value (PEBV) ratio of 3.0, which means the market expects the company’s profits to triple from current levels. Additionally, NXP Semiconductors has a market-implied growth appreciation period (GAP) of greater than 100 years based on our Robo-Analyst’s default scenario in our reverse discounted cash flow (DCF) model.
Despite trading at $231/share, NXP Semiconductors has an economic book value (EBV), or no-growth value, of $76/share, or 67% below its current price, in large part because of its fair value of total debt of $10.4 billion, $362 million in minority interests, and $343 million in underfunded pensions.
Proof Is In Performance
You don’t have to take our word for it when we say picking stocks based on Core Earnings drives novel alpha.
The outperformance of the Bloomberg New Constructs Core Earnings Leaders Index provides real-time proof.
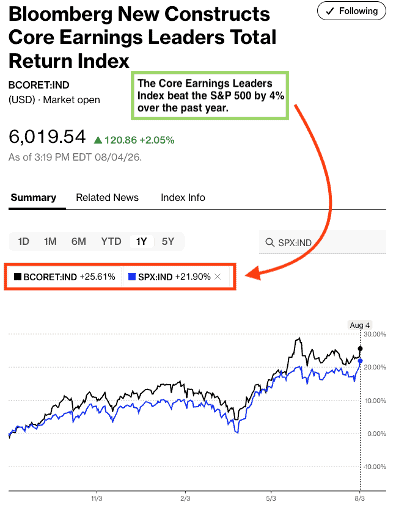
The Bloomberg New Constructs Core Earnings Leaders Index, which allocates based on Earnings Capture and Core Earnings, beat the S&P 500 by 4% over the past year. The Index (ticker: BCORET:IND) was up 26% while the S&P 500 was up 22%.
Figure 3: Bloomberg New Constructs Core Earnings Leaders Index Outperforms S&P 500: One Year
Sources: Bloomberg as of August 4, 2026
Note: Past performance is no guarantee of future results.
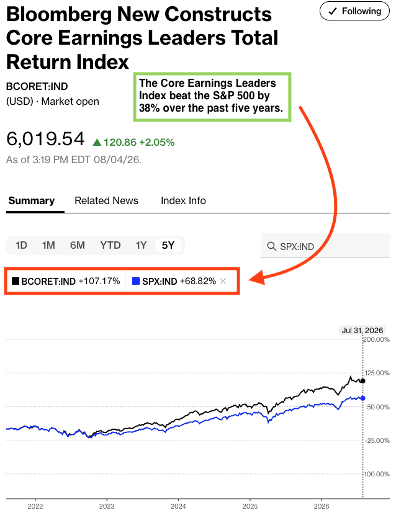
The Bloomberg New Constructs Core Earnings Leaders Index beat the S&P 500 by 38% over the past five years. The Index was up 107% while the S&P 500 was up 69%.
Figure 4: Bloomberg New Constructs Core Earnings Leaders Index Outperforms S&P 500: Last 5 Years
Sources: Bloomberg as of July 31, 2026
Note: Past performance is no guarantee of future results.
This article was originally published on August 10, 2026.
Disclosure: David Trainer and Kyle Guske II receive no compensation to write about any specific stock, style, or theme.
Questions on this report or others? Join our online community and connect with us directly.
[1] This Journal of Financial Economics paper by Harvard Business School and MIT Sloan professors empirically proves the idiosyncratic alpha in Core Earnings.