
This report is an abridged and free version of All Cap Index & Sectors: Price to Economic Book Value Through 2Q21, one of the reports in our quarterly series on fundamental market and sector trends, available to Pro and higher members. More free reports on the fundamental trends for the overall market and each sector are available here.
The full version of this report analyzes[1] market cap, economic book value, and the trailing price-to-economic book value (PEBV) ratio for the NC 2000[2], our All Cap Index, and each of its sectors (last quarter’s analysis is here). Our research is based on the latest audited financial data, which is the 2Q21 10-Q for most companies. Price data is as of 8/18/21.
These reports leverage more reliable fundamental data[3] that overcomes flaws with legacy fundamental datasets. Our Earnings Distortion factor generates substantial idiosyncratic alpha.
NC 2000 Trailing PEBV Ratio Remained Flat YoY
The trailing PEBV ratio for the NC 2000 remained flat at 1.5 from 2Q20 through 8/18/21. See Figure 1 in the full version of our report for the chart of PEBV Ratio for the NC 2000 from December 1998 through 2Q21.
The trailing PEBV ratio compares the NC 2000’s expected future profits (embedded in its equity valuation) to TTM profits in 2Q21. At 1.5, the NC 2000’s valuation implies the profits of the NC 2000 stocks will increase 50% from 2Q21 levels.
Key Details on Select NC 2000 Sectors
Three NC 2000 sectors, Telecom Services, Consumer Non-cyclicals, and Financials, trade below their economic book value. The Telecom Services sector has the lowest trailing PEBV ratio among all 11 All Cap Index sectors based on prices as of 8/18/21 and financial data from 2Q21 10-Qs.
A trailing PEBV ratio of 0.6 means investors expect the Telecom Service sector’s profits as of 2Q21 to decline by 40%. On the flip side, investors expect the Energy sector (trailing PEBV ratio of 6.7) to improve profits more than any other All Cap Index sector. Below, we highlight the Energy sector, which has the highest PEBV of all NC 2000 sectors in 2Q21.
Sample Sector Analysis[4]: Energy: Trailing PEBV Ratio = 6.7
Figure 1 shows the trailing PEBV ratio for the Energy sector rose from 2.9 in 2Q20 to 6.9 in 2Q21. The Energy sector market cap rose from $965 billion in 2Q20 to $1.3 trillion in 2Q21, while its economic book value fell from $985 billion in 2Q20 to $194 billion in 2Q21.
Figure 1: Energy Trailing PEBV Ratio: December 1998 – 8/18/21
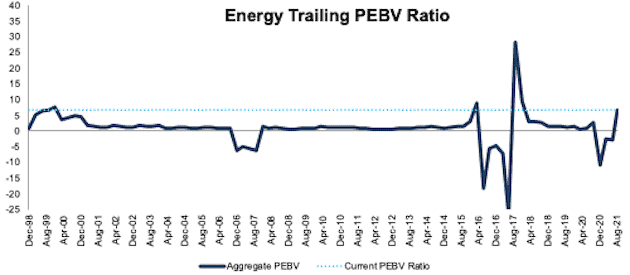
Sources: New Constructs, LLC and company filings.
The August 18, 2021 measurement period uses price data as of that date and incorporates the financial data from 2Q21 10-Qs, as this is the earliest date for which all the 2Q21 10-Qs for the NC 2000 constituents were available. .
Figure 2 compares the market cap and economic book value trends for the Energy sector since 1998. We sum the individual NC 2000/sector constituent values for market cap and economic book value. We call this approach the “Aggregate” methodology, and it matches S&P Global’s (SPGI) methodology for these calculations.
Figure 2: Energy Market Cap & Economic Book Value: December 1998 – 8/18/21
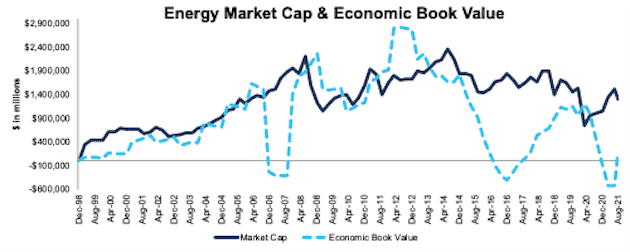
Sources: New Constructs, LLC and company filings.
The August 18, 2021 measurement period uses price data as of that date and incorporates the financial data from 2Q21 10-Qs, as this is the earliest date for which all the 2Q21 10-Qs for the NC 2000 constituents were available.
The Aggregate methodology provides a straightforward look at the entire NC 2000/sector, regardless of firm size or index weighting, and matches how S&P Global (SPGI) calculates metrics for the S&P 500.
For additional perspective, we compare the Aggregate method for trailing PEBV ratio with two other market-weighted methodologies. These market-weighted methodologies add more value for ratios that do not include market values, e.g. ROIC and its drivers, but we include them here, nonetheless, for comparison. Each method has its pros and cons, which are detailed in the Appendix.
Figure 3 compares these three methods for calculating the Energy sector’s trailing PEBV ratios.
Figure 3: Energy Trailing PEBV Ratio Methodologies Compared: December 1998 – 8/18/21
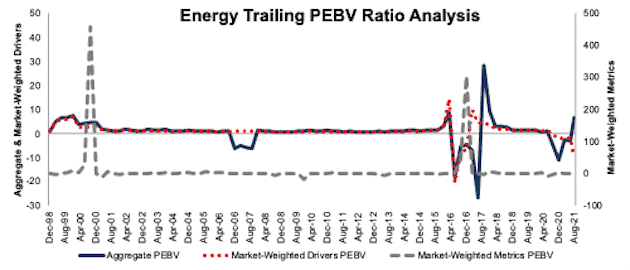
Sources: New Constructs, LLC and company filings.
The August 18, 2021 measurement period uses price data as of that date and incorporates the financial data from 2Q21 10-Qs, as this is the earliest date for which all the 2Q21 10-Qs for the NC 2000 constituents were available.
This article originally published on September 2, 2021.
Disclosure: David Trainer, Kyle Guske II, Alex Sword, and Matt Shuler receive no compensation to write about any specific stock, style, or theme.
Follow us on Twitter, Facebook, LinkedIn, and StockTwits for real-time alerts on all our research.
Appendix: Analyzing Trailing PEBV Ratio with Different Weighting Methodologies
We derive the metrics above by summing the individual NC 2000/sector constituent values for market cap and economic book value to calculate trailing PEBV ratio. We call this approach the “Aggregate” methodology.
The Aggregate methodology provides a straightforward look at the entire NC 2000/sector, regardless of firm size or index weighting, and matches how S&P Global (SPGI) calculates metrics for the S&P 500.
For additional perspective, we compare the Aggregate method for trailing PEBV ratio with two other market-weighted methodologies. These market-weighted methodologies add more value for ratios that do not include market values, e.g. ROIC and its drivers, but we include them here, nonetheless, for comparison:
- Market-weighted metrics – calculated by market-cap-weighting the trailing PEBV ratio for the individual companies relative to their sector or the overall NC 2000 in each period. Details:
- Company weight equals the company’s market cap divided by the market cap of the NC 2000 or its sector
- We multiply each company’s trailing PEBV ratio by its weight
- NC 2000/Sector trailing PEBV ratio equals the sum of the weighted trailing PEBV ratios for all the companies in the NC 2000/sector
- Market-weighted drivers – calculated by market-cap-weighting the market cap and economic book value for the individual companies in each sector in each period. Details:
- Company weight equals the company’s market cap divided by the market cap of the NC 2000 or its sector
- We multiply each company’s market cap and economic book value by its weight
- We sum the weighted market cap and weighted economic book value for each company in the NC 2000/each sector to determine the NC 2000 or sector’s weighted market cap and weighted economic book value
- NC 2000/Sector trailing PEBV ratio equals weighted NC 2000/sector market cap divided by weighted NC 2000/sector economic book value
Each methodology has its pros and cons, as outlined below:
Aggregate method
Pros:
- A straightforward look at the entire NC 2000/sector, regardless of company size or weighting in any indices.
- Matches how S&P Global calculates metrics for the S&P 500.
Cons:
- Vulnerable to impact of companies entering/exiting the group of companies, which could unduly affect aggregate values. Also susceptible to outliers in any one period.
Market-weighted metrics method
Pros:
- Accounts for a firm’s market cap relative to the NC 2000/sector and weights its metrics accordingly.
Cons:
- Vulnerable to outlier results from a single company disproportionately impacting the overall trailing PEBV ratio.
Market-weighted drivers method
Pros:
- Accounts for a firm’s market cap relative to the NC 2000/sector and weights its size and economic book value accordingly.
- Mitigates the disproportionate impact of outlier results from one company on the overall results.
Cons:
- More susceptible to large swings in market cap or economic book value (which can be impacted by changes in WACC) period over period, particularly from firms with a large weighting in the NC 2000/Sector.
[1] We calculate these metrics based on S&P Global’s (SPGI) methodology, which sums the individual NC 2000 constituent values for market cap and economic book value before using them to calculate the metrics. We call this the “Aggregate” methodology.
[2] The NC 2000 consists of the largest 2000 U.S. companies by market cap in our coverage. Constituents are updated on a quarterly basis (March 31, June 30, September 30, and December 31). We exclude companies that report under IFRS and non-U.S. ADR companies.
[3] For 3rd-party reviews, including The Journal of Financial Economics, on our more reliable fundamental data, historically and prospectively, across all stocks, click here and here.
[4] The full version of this report provides analysis for every sector like what we show for this sector.