
In what turned out to be a “kitchen sink” year, corporate managers used COVID-19 as a justification to write-down more assets in 2020 than any year since 2008. With the books “cleaned up”, S&P 500 companies are on pace to record the lowest amount of write-downs in 15 years. We see a similar trend in Small Cap and All Cap companies.
In this report, we’ll look at the write-down trends across the S&P 500, NC 1500 (our proxy for Small Cap companies), and the NC 2000 (our proxy for All Cap companies).
These reports leverage more reliable fundamental data[1] that overcomes flaws with legacy fundamental datasets. Our Earnings Distortion factor generates substantial idiosyncratic alpha.
S&P 500 1H21: Write-Downs Are 81% Lower than 1H20
The total value of pre-tax[2] write-downs for the S&P 500 in 1H21 is $33.6 billion, or just 12% of the total write-downs in 2020. Our analysis shows write-downs tend to spike (“kitchen sink” effect) when stock markets and economic growth sink as they did during the financial crisis of 2008, the economic turbulence in 2015, and the pandemic-driven disruptions in 2020.
Figure 1: S&P 500: Total Write-Downs Pre-Tax: 2004[3] through First Half of 2021
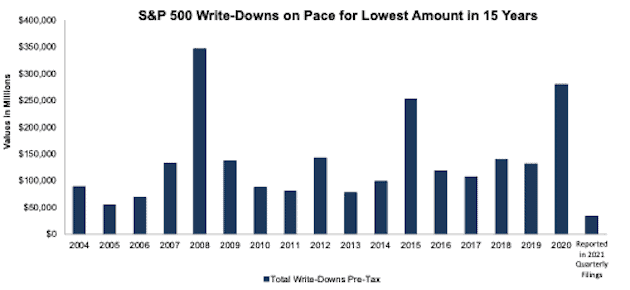
Sources: New Constructs, LLC, and company filings
S&P 500 1H21: Write-Downs by Quarter
In 1Q21, S&P 500 companies disclosed $16.3 billion in pre-tax write-downs, 84% less than 1Q20 and just 6% of the total for 2020. In 2Q21, we found another $17.3 billion in pre-tax write-downs for the S&P 500. See Figure 2.
Figure 2: S&P 500: Write-Downs in 2020 vs 1Q21 and 2Q21
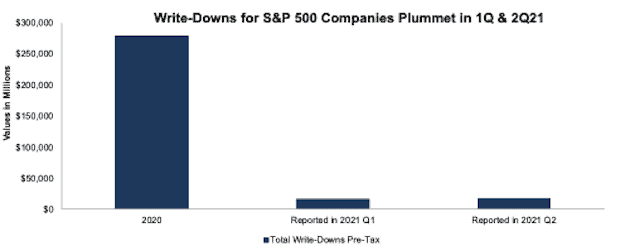
Sources: New Constructs, LLC, and company filings
S&P 500: Write-Downs In 1H21 vs 1H20
Pre-tax write-downs in the first half of 2021 totaled $33.6 billion or 19% of the total pre-tax value of write-downs in the first half of 2020.
Figure 3: S&P 500: Write-Downs in First Half of 2020 vs 2021
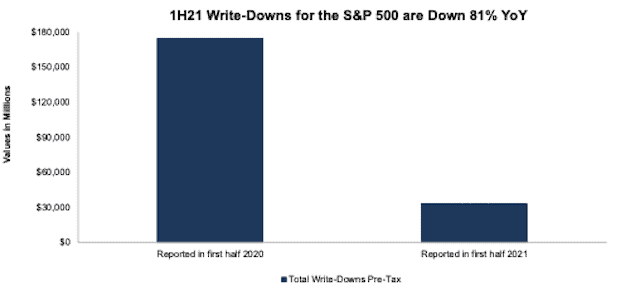
Sources: New Constructs, LLC, and company filings
Small Cap Companies: 1H21: Write-Downs Are 89% Lower than 1H20
We found is ~$10.6 billion in pre-tax write-downs, or 8% of the total in 2020, for Small Cap companies in 1H21. Going back to the tech bubble, our analysis shows write-downs tend to spike when stock markets and economic growth lag.
The NC 1500 Small Cap index represents the aggregated results for the smallest 1500 companies by market cap in our NC 2000 All Cap index for each period. The list changes in each period based on the market caps of the companies in each period.
Figure 4: NC 1500 Small Cap: Total Write-Downs Pre-Tax: 1998 through First Half of 2021
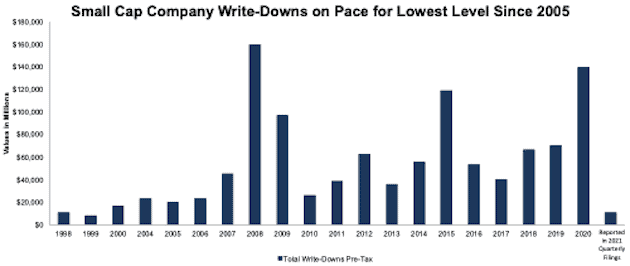
Sources: New Constructs, LLC, and company filings
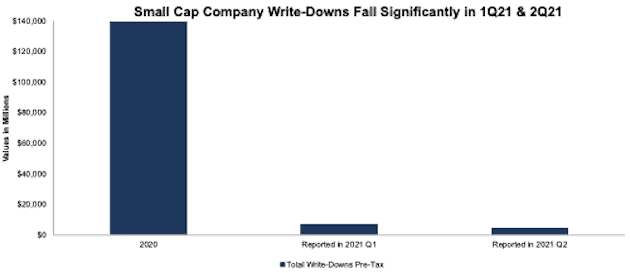
Small Cap Companies: 1H21: Massive Drop-off in Charges in 1Q21 & 2Q21
In 1Q21 Small Cap companies disclosed $6.6 billion in pre-tax write-downs, 90% less than 1Q20 and just 5% of the total for 2020. In 2Q21, we found another $4 billion in pre-tax write-downs, 87% less than 2Q20.
Figure 5: NC 1500 Small Cap: Write-Downs in 2020 vs 1Q21 and 2Q21
Sources: New Constructs, LLC, and company filings
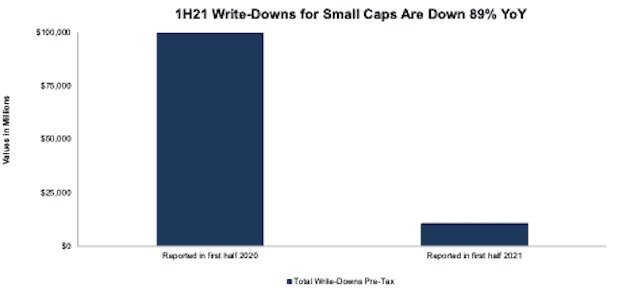
Small Cap Companies: Write-Downs in 1H21 vs 1H20
Pre-tax write-downs in the first half of 2021 totaled $10.6 billion, or just 11% of the total pre-tax value of write-downs in the first half of 2020.
Figure 6: NC 1500 Small Cap: Write-Downs in First Half of 2020 vs First Half of 2021
Sources: New Constructs, LLC, and company filings
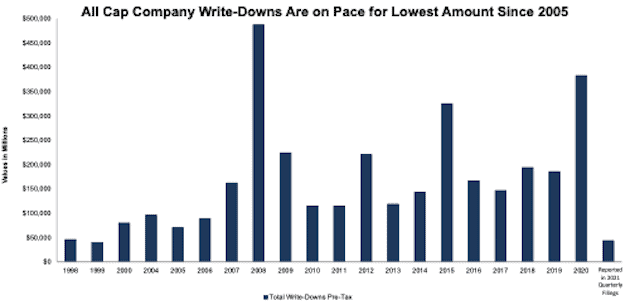
All Cap Companies: 1H21: Write-Downs Are 82% Lower Than 1H20
We found $43.5 billion in pre-tax write-downs, or 11% of the total in 2020, for our All Cap index in 1H21.
The NC 2000 All Cap index represents the aggregated results for the largest 2000 companies by market cap in our coverage universe for each period. The list changes in each period based on the market caps of the companies in each period.
Figure 7: NC 2000 All Cap: Total Write-Downs Pre-Tax: 1998 through First Half of 2021
Sources: New Constructs, LLC, and company filings
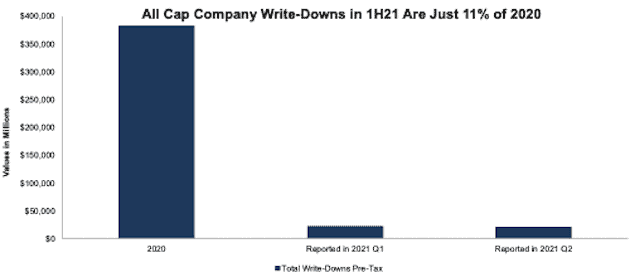
All Cap Companies: 1H21: Write-Downs by Quarter
In 1Q21, our All Cap index of companies disclosed $22.4 billion of pre-tax write-downs, 85% less than 1Q20 and just 6% of the total for 2020. In 2Q21, we found another $21.1 billion in pre-tax write-downs, 77% less than 2Q20.
Figure 8: NC 2000 All Cap: Write-Downs in 2020 vs 1Q21 and 2Q21
Sources: New Constructs, LLC, and company filings
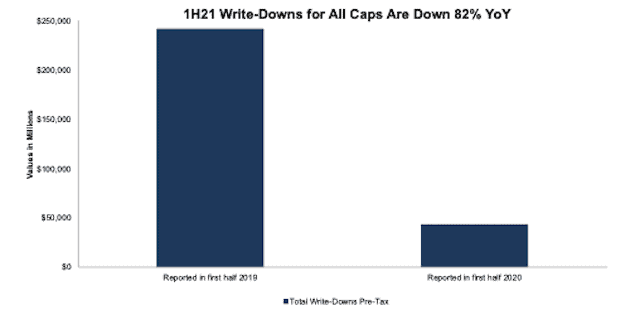
All Cap Companies: Write-Downs In 1H21 vs 1H20
Pre-tax write-downs in the first half of 2021 totaled $43.5 billion or 18% of the total pre-tax value of write-downs in the first half of 2020 for our All Cap index.
Figure 9: NC 2000 All Cap: Write-Downs in First Half of 2020 vs 2021
Sources: New Constructs, LLC, and company filings
This article originally published on October 12, 2021.
Disclosure: David Trainer, Kyle Guske II, and Matt Shuler receive no compensation to write about any specific stock, sector, style, or theme.
Follow us on Twitter, Facebook, LinkedIn, and StockTwits for real-time alerts on all our research.
[1] For 3rd-party reviews, including The Journal of Financial Economics, on our more reliable fundamental data, click here and here.
[2] This report focuses on “pre-tax” values though we also have the after-tax values for all views presented.
[3] Our S&P 500 research goes back to 2004. Our data on All Cap and Small Cap stocks go back to 1998.