
We published an update on this Danger Zone pick on August 9, 2021. A copy of the associated Earnings Update report is here.
Editor’s Note on 3/23/2021
We updated this report to correct the implied user growth in Pinterest’s (PINS: $62/share) valuation, the stock price when we originally published the report, after we realized that we incorrectly calculated the monthly active users (MAUs) implied by the stock price based on quarterly average revenue per user (ARPU) instead of annual average revenue per user (ARPU).
After correcting this error, our thesis remains unchanged given that Pinterest’s valuation implies it will double ARPU and more than quadruple MAUs.
Based on the stock’s movement, 3Q20 was a standout quarter for Pinterest. The stock jumped 27% the day after reporting a large year-over-year (YoY) increase in international monthly active users, a relatively smaller increase in United States MAUs, and YoY improvement in average revenue per user. While it’s great to see some improvement in the firm’s fundamentals, this improvement is nowhere near enough to narrow the chasm between the current profitability of the firm and future profitability required to justify the stock price.
The risk in owning this stock remains high based on Pinterest’s:
- Valuation implies Pinterest will double ARPU and have >3/4ths the users of Facebook (FB)
- Monetization of users remains well below peers
- ARPU growth, even after the jump in 3Q20, remains in long-term downtrend
- Low switching costs for advertisers makes future profitability uncertain
Doing the Math: Valuation Implies MAUs Reach Over Half the Global Population
Despite the improvement in 3Q20, the expectations for future profitability baked into Pinterest’s stock price remain astronomical.
Below, we present just how disconnected this stock’s price is from the company’s fundamentals, updated for 3Q20 results, so that fiduciaries and longer-term investors can plainly see why this stock is too risky for them and their clients.
First, Pinterest’s current economic book value, or no growth value, is -$13/share. Nevertheless, we’ll take a close look at the value of the stock if we give the firm credit for being able to grow into a profitable enterprise.
We’ll start with using our reverse discounted cash flow (DCF) model to analyze the expectations implied by the current valuation.
To justify its current price of $62/share, Pinterest must immediately:
- Improve its NOPAT margin to 27% (compared to -27% TTM)
- 27% is the midpoint of Twitter (16% in 2018) and Facebook’s (38% in 2017) best-ever NOPAT margins and
- Grow revenue by 30% compounded annually for the next 10 years.
For reference, consensus estimates project Pinterest’s revenue will grow 22%, much lower than our assumption for this scenario, compounded annually over the next decade. See the math behind this reverse DCF scenario.
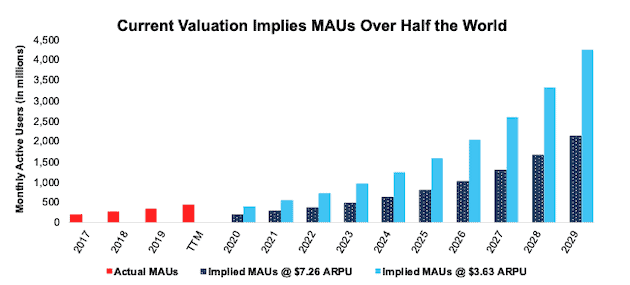
In this scenario, Pinterest would generate over $15 billion in revenue 10 years from now, compared to $1.4 billion TTM. At its annual ARPU[1], $3.63 at the end of 3Q20, this scenario implies the firm would have over 4.2 billion MAUs, or 54% of the current global population.
Here’s another scenario for comparison: we optimistically assume Pinterest can immediately double its ARPU to $7.26, then Pinterest needs over 2 billion MAUs to achieve the revenue implied by its stock price.
In other words, even if Pinterest can double ARPU, it must have more than 2x the MAUs (10 years from now) of Instagram and 78% the MAUs of Facebook in 3Q20 to justify its current stock price. Figure 1 illustrates the staggering level of these expectations compared to current and historical figures.
Figure 1: PINS’s Actual MAUs vs. Implied MAUs
Sources: New Constructs, LLC and company filings.
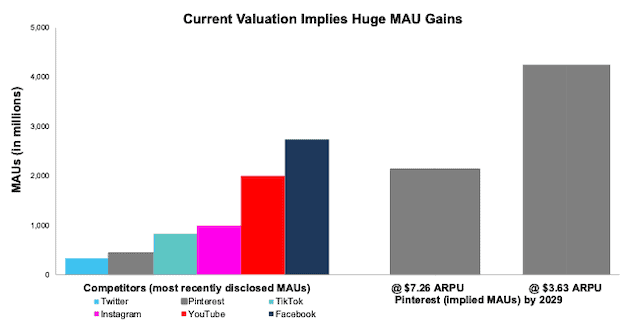
For further comparison, we compare the MAUs implied by Pinterest’s stock price to some of its largest competitors in Figure 2. At its current ARPU, Pinterest’s stock price implies it will have more MAUs (in 10 years) than Facebook, TikTok, Instagram, Twitter, or YouTube currently have.
Figure 2: PINS’s Valuation Implies MAUs Will Dwarf Competition
Sources: New Constructs, LLC and company filings.
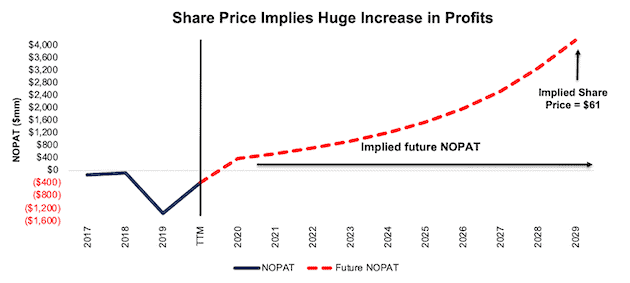
Figure 3 compares the firm’s implied future NOPAT in this scenario to its historical NOPAT. For reference, this scenario implies Pinterest’s NOPAT will reach $4.2 billion in 2029, which is nearly equal to retailer Target’s (TGT) TTM NOPAT and almost double online marketplace eBay’s (EBAY) TTM NOPAT. In any scenario worse than this one, Pinterest holds significant downside risk, as we’ll show.
Figure 3: Valuation Implies Pinterest’s NOPAT Will Be Nearly Double eBay’s
Sources: New Constructs, LLC and company filings.
Significant Downside in a More Realistic Scenario
Given the competitive issues discussed in our original report, we believe the future cash flow scenario above is highly unlikely, if not impossible for Pinterest to achieve.
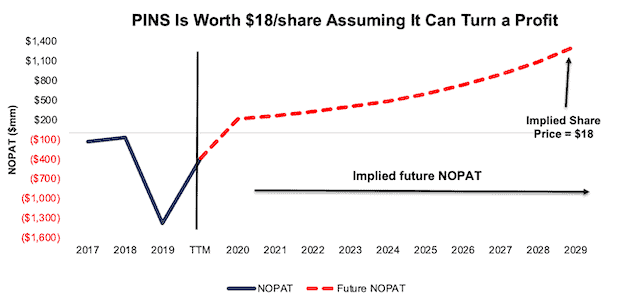
If we lower expectations and assume Pinterest can achieve a 16% NOPAT margin (equal to Twitter’s best ever margin) and grow revenue by 22% compounded annually (equal to longer-term consensus estimates through 2029) for the next decade, the stock is worth only $18/share today – a 71% downside to the current stock price. See the math behind this reverse DCF scenario.
Figure 4 compares the firm’s implied future NOPAT in this scenario to its historical NOPAT.
Figure 4: Pinterest Has Large Downside Risk: DCF Valuation Scenario
Sources: New Constructs, LLC and company filings.
As shown above, Pinterest’s 3Q20 results do little to close the gap between the current performance of the firm and the performance implied by the stock price. Additionally, the 3Q20 results do little to combat the competitive pressures that will make it more difficult for Pinterest to fulfil the expectations implied by its stock price.
Weakest ARPU Reflects Inability to Monetize Users
Pinterest’s ARPU remains worst amongst its main peers, Facebook (FB), Twitter (TWTR), and Snap (SNAP), which indicates it is either under-monetizing its user base or, worse, is unable to monetize its user base.
Figure 5: ARPU vs. Peers in 3Q20

Sources: New Constructs, LLC and company filings.
Most User Growth Remains Confined to Unprofitable Markets
While Pinterest reported strong MAUs growth in 3Q20 as, the long-term trends in the firm’s user base don’t bode well for future profitability.
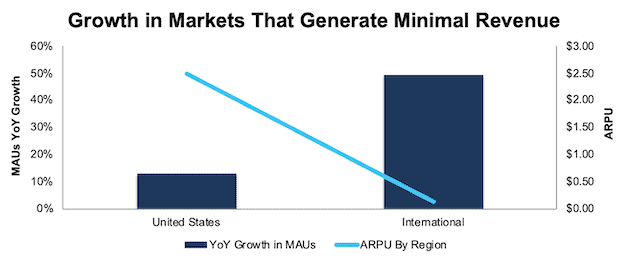
Much of the firm’s growth is coming from its least lucrative market: “International.” Pinterest’s International MAUs grew 46% YoY in 3Q20, compared to just 13% YoY in the United States. Unfortunately, International ARPU is $0.21 compared to $3.85 in the United States. See Figure 6.
The lower ARPU in Pinterest’s fastest growing and largest segment exacerbates the firm’s already negative profitability. Increasing ARPU in these regions is no sure bet. Even Facebook, which has the highest ARPU of peers in Figure 5, generates significantly lower ARPU outside the United States. ARPU in the Asia-Pacific and Rest of World regions was just $3.67 and $2.22 in 3Q20 respectively, while the European region is higher at $12.41.
Figure 6: MAU Growth & ARPU by Geographic Region – 3Q20
Sources: New Constructs, LLC and company filings.
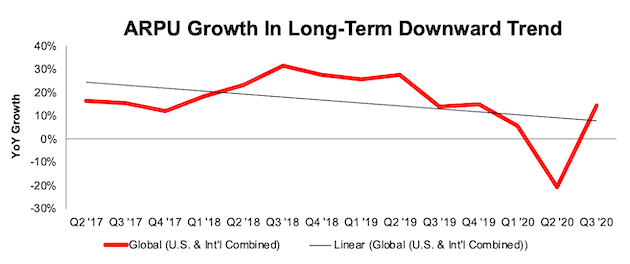
More broadly, the longer-term trend in ARPU growth, even after the jump in 3Q20, is trending downward, too. The firm’s Global ARPU (which includes the U.S. and International regions) grew 14% YoY in 3Q20, which is equal to the YoY growth rate in 3Q19, and well below the 32% YoY growth rate in 3Q18, per Figure 7. It’s going to be tough for Pinterest to regain the highs it saw in ARPU growth given the intense competitive environment.
Figure 7: YoY ARPU Growth Rates: 2Q17 Through 3Q20
Sources: New Constructs, LLC and company filings.
Path to Profitability Is Still Elusive
As noted in our original report, Pinterest’s path to profitability requires either a huge increase in ARPU or significant reduction in expenses. With intense competition limiting ARPU growth, the reduction in expenses seems like the only way to achieve any level of profits. However, cutting costs would likely spook shareholders because it would signal that Pinterest is giving up on its version of the ever-popular growth-at-all-costs strategy.
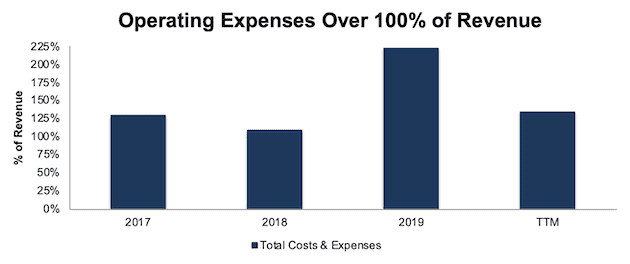
Nevertheless, we can review the drastic cost cutting required to have any meaningful impact on profitability, incorporating the firm’s most recent 3Q20 results. Pinterest’s cost of revenue, research & development, sales & marketing, and general & administrative costs (“Total Costs & Expenses”) are still 128% of revenue over the TTM period, per Figure 8. For reference, Pinterest was closest to generating positive core earnings in 2018, and Total Costs & Expenses were still 110% of revenue in that year.
Management would have to cut costs by 21% to achieve breakeven on a pre-tax basis.
Figure 8: Total Costs & Expenses as a Percent of Revenue: 2017 Through TTM
Sources: New Constructs, LLC and company filings.
Additionally, Pinterest’s NOPAT margin, invested capital turns (a measure of balance sheet efficiency), and return on invested capital (ROIC) still rank well below all competitors except Snap, which we recently featured in the Danger Zone.
Figure 9: TTM NOPAT Margin, Invested Capital Turns, and ROIC vs. Competition

Sources: New Constructs, LLC and company filings.
Given the above, particularly the expectations implied by the current stock price, investors with fiduciary responsibilities would be hard pressed to make an argument for taking on the risk of investing in Pinterest.
You can read our original article, with additional details on the competitive pressures against Pinterest, acquisition scenario analysis, and more here: The World Is Not Enough for this Stock.
This article originally published on November 13, 2020.
Disclosure: David Trainer, Kyle Guske II, and Matt Shuler receive no compensation to write about any specific stock, sector, style, or theme.
Follow us on Twitter, Facebook, LinkedIn, and StockTwits for real-time alerts on all our research.
[1] Calculated as TTM revenue of $1.4 billion divided by the average MAUs at the beginning and end of the period (4Q19 through 3Q20).