
We published an update on this Danger Zone pick on August 9, 2021. A copy of the associated Earnings Update report is here.
Editor’s Note on 3/23/2021
We updated this report to correct the implied user growth in Pinterest’s (PINS: $51/share) valuation, the stock price when we originally published the report, after we realized that we incorrectly calculated the monthly active users (MAUs) implied by the stock price based on quarterly average revenue per user (ARPU) instead of annual average revenue per user (ARPU).
After correcting this error, our thesis remains unchanged given that Pinterest’s valuation implies it will double ARPU and quadruple MAUs.
Check out this week’s Danger Zone interview with Chuck Jaffe of Money Life.
We first published our concerns about Pinterest before its IPO in April 2019: Pre-IPO Coverage: Pinterest (PINS).
Now, with the stock trading ~168% above its IPO price, the valuation implies the firm will have more MAUs than Facebook assuming it maintains its current average revenue per user. Fiduciaries should consider this stock extremely risky, especially in today’s market. Pinterest (PINS: $51/share) is this week’s Danger Zone pick.
Investors with fiduciary responsibilities need to consider just how much risk they take by owning PINS at current levels. This report shows how extreme the risk in PINS is based on:
- Easily replicable offering – very low switching costs
- ARPU growth is slowing and declined in 2Q20
- Valuation implies Pinterest will double ARPU and have ~2/3rds the users of Facebook (FB).
Intense Competition Limits Growth Potential
As its days of hyper growth have passed, there’s less reason to believe Pinterest stands a chance of achieving the growth expectations baked into its stock price. For example, revenue grew 60% year-over-year (YoY) in 2018 and 51% YoY in 2019. Consensus estimates expect revenue will grow 29% YoY in 2020, 19% YoY by 2023, and, then, low double-digits in the years beyond, per Figure 1.
Pinterest, as with many other social platforms, faces an increasingly uphill battle to grow revenue at high rates as the fight for ad dollars intensifies.
Figure 1: Historical Revenue Growth & Consensus Estimates: 2018-2029
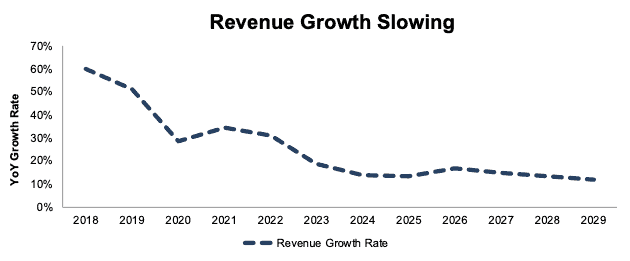
Sources: New Constructs, LLC and company filings.
2020-2029 revenue growth rates based on consensus estimates
Unlimited Competition Is a Very Bad Thing
Pinterest’s business model focuses on selling advertising, which means its competition includes any locations where ads can be displayed, both on and offline. Direct competitors include Facebook (FB) and Alphabet (GOOGL), which together account for upwards of 50% of digital ad spending, as well as, Twitter (TWTR), Snap (SNAP), ByteDance (owner of TikTok), and many more.
More broadly, one could argue that Pinterest competes against all consumable content. Any minute spent viewing something outside of Pinterest is time the firm is unable to sell advertising. With so much content in the world today (social media, streaming and live TV, video games), the competition for ad spending has never been tougher.
Further, as more of a search tool than social application, Pinterest offerings are not as sticky or interactive as its peers. Facebook, Twitter, and Snap provide unique ways to interact with other users, while Pinterest users interact mostly with images and videos that are more common and far less personal.
Consumers have many alternatives to Pinterest. It’s more difficult to replicate the community aspect and personal interaction found on other social media platforms and therefore Pinterest’s competition also includes any and all places consumers can find and buy products, such as:
- Search engines – including Google’s shopping search results
- Traditional TV – HGTV, DIY Network and The Cooking Channel [owned by Discovery (DISCA)] as well as QVC or HSN
- Amazon (AMZN), Google (GOOGL) or eBay (EBAY)
- Home goods stores, particularly ones that provide curated design ideas/guides, such as Williams-Sonoma (WSM) or Restoration Hardware (RH)
Despite its broad appeal, Pinterest’s monthly active users, at 416 million in 2Q20, remain well below its direct competitors. Facebook reported 2.7 billion MAUs in 2Q20 and Instagram has over 1 billion MAUs. Twitter (TWTR) has an estimated 330 million MAUs (the firm reports daily active users instead of MAUs), and YouTube has 2 billon MAUs.
Facing nearly unlimited competition for the attention of consumers makes the prospect of turning a profit very low. Bulls will argue that Pinterest’s user base is more valuable, as users largely go to the app in search of products, rather than interact with family photos, messages, or groups where ads may feel more intrusive. However, Pinterest’s -34% profit margin does not support that thesis.
One could argue that Pinterest users like to “window shop” on Pinterest while buying on other platforms, like Amazon, eBay, or Google where they know they can get a wider selection and competitive pricing.
How else to explain such poor profit margins for a business as mature as Pinterest?
Weakest ARPU Reflects Inability to Monetize Users
In addition to slowing ARPU growth and a YoY decline in 2Q20 (more details below), Pinterest’s ARPU is worst amongst its main peers, Facebook, Twitter, and Snap, which indicates it is either under-monetizing its user base, or worse, is unable to monetize its user base.
Figure 2: ARPU vs. Peers in 2Q20

Sources: New Constructs, LLC and company filings.
User Growth Is Bad When in Unprofitable Markets
While Pinterest reported strong MAUs growth in 2Q20 as the COVID-19 pandemic pushed consumers inside and onto their devices more, the long-term trends in the firm’s user base don’t bode well for future profitability.
Much of the firm’s growth is coming from its least lucrative market: “International.” Pinterest’s International MAUs grew 49% YoY in 2Q20, compared to just 13% YoY in the United States. Unfortunately, International ARPU is $0.14 compared to $2.50 in the United States. The 2Q20 growth in the United States is the first YoY double-digit growth in MAUs since 2Q19 in that region. See Figure 3.
The lower ARPU in Pinterest’s fastest growing and largest segment exacerbates the firm’s already negative profitability.
Figure 3: MAU Growth & ARPU by Geographic Region – 2Q20
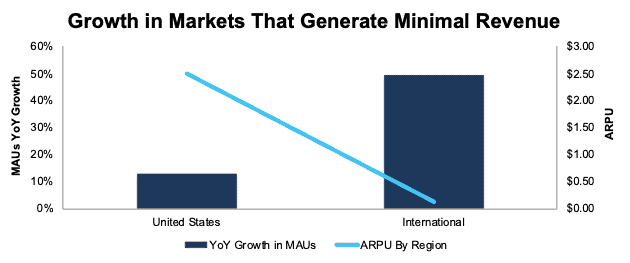
Sources: New Constructs, LLC and company filings.
More broadly, the rate at which Pinterest is improving ARPU is slowing, too. The firm’s Global ARPU (which includes the U.S. and International regions) grew 28% YoY in 2Q19, 5% YoY in 1Q20, and fell 20% YoY in 2Q20, per Figure 4. While the decline in 2Q20 is likely driven by COVID-19-induced cuts to marketing/advertising spend across the world, the longer-term trend in ARPU growth is clearly poor and unlikely to make much of a turnaround given the intense competitive environment.
ARPU in the United States segment grew 46% YoY in 2Q18, 41% YoY in 2Q19, and fell 11% YoY in 2Q20.
International ARPU grew 25% YoY in 2Q18, 120% YoY in 2Q19, and 27% YoY in 2Q20.
Figure 4: YoY ARPU Growth Rates: 2Q17 through 2Q20
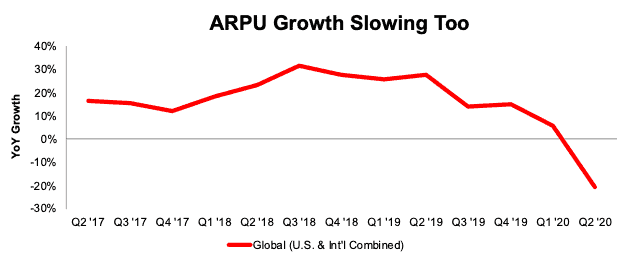
Sources: New Constructs, LLC and company filings.
Is There a Path to Profitability?
Pinterest’s path to profitability requires either a huge increase in ARPU or significant reduction in expenses. With intense competition limiting ARPU growth, the reduction in expenses seems like the only way to achieve any level of profits. However, cutting costs would likely spook shareholders because it would signal that Pinterest is giving up on its version of the ever-popular growth-at-all-costs strategy.
Management seems to agree. In its latest 10-Q, the firm notes “we also anticipate that our operating expenses will increase substantially in the foreseeable future if we continue to expand operations domestically and internationally, enhance our product offerings, broaden our Pinner and advertiser base, expand our marketing channels, hire additional employees, and develop our technology.” In other words, to remain competitive, Pinterest is ramping up spending, not cutting back to achieve profitability.
Nevertheless, we’ll review the drastic cost cutting required to have any meaningful impact on profitability. Pinterest’s cost of revenue, research & development, sales & marketing, and general & administrative costs (“Total Costs & Expenses”) are an astonishing 135% of revenue over the TTM period, per Figure 5. For reference, Pinterest was closest to generating positive core earnings in 2018, and Total Costs & Expenses were still 110% of revenue in that year.
Management would have to cut costs by 26% to achieve breakeven on a pre-tax basis.
Figure 5: Total Costs & Expenses as a Percent of Revenue: 2017 through TTM
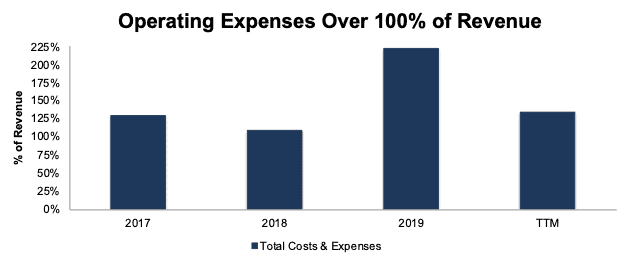
Sources: New Constructs, LLC and company filings.
Per Figure 6, Pinterest’s NOPAT margin, invested capital turns (a measure of balance sheet efficiency) and return on invested capital (ROIC) rank well below all competitors except Snap, which we recently featured in the Danger Zone.
Figure 6: TTM NOPAT Margin, Invested Capital Turns, and ROIC vs. Competition
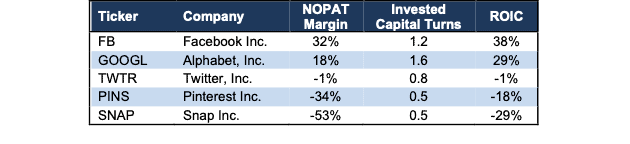
Sources: New Constructs, LLC and company filings.
Pinterest’s lack of profitability reflects the downside to a growth-at-all-costs mentality and the lack of meaningful monetization.
Growth at All Costs Leads to Big Losses
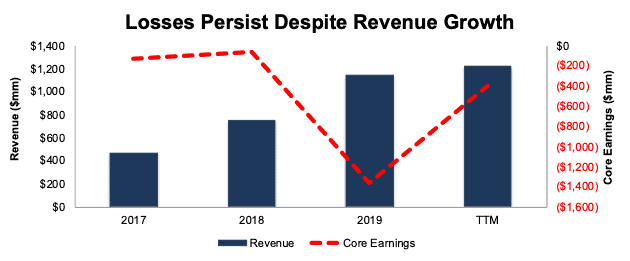
Despite the COVID-19-induced increase in users, Pinterest’s TTM profitability remains lower than 2017 and 2018 levels. Per Figure 7, Pinterest has grown revenue by 55% compounded annually since 2017. However, Pinterest’s core earnings[1], which have never been positive, fell from -$129 million in 2017 to -$398 million over the TTM.
Figure 7: Revenue Vs. Core Earnings: 2017 through TTM
Sources: New Constructs, LLC and company filings.
Don’t Fall for Non-GAAP Results
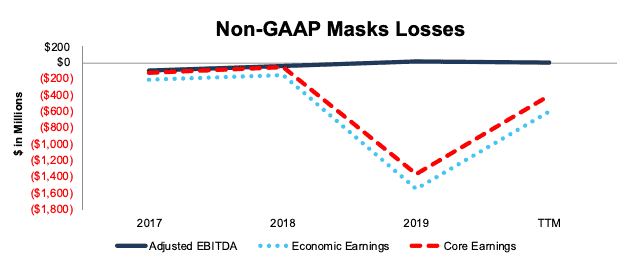
As with most unprofitable firms, Pinterest sports flawed non-GAAP metrics such as adjusted EBITDA and non-GAAP net loss, which paint a rosier picture of the firm’s losses. Non-GAAP metrics allow management significant leeway in removing actual costs of the business to present a more optimistic view.
Share-based compensation expense is the largest item Pinterest excludes when calculating its non-GAAP metrics. Over the TTM, Pinterest removed $386 million (32% of revenue) in share-based compensation expense when calculating adjusted EBITDA. Per Figure 8, Pinterest’s TTM adjusted EBITDA of -$6 million is well above core earnings of -$398 million. Economic earnings, which remove unusual gains/losses and changes to the balance sheet, are even lower, at -$594 million TTM.
Figure 8: Non-GAAP Net Loss vs. Core and Economic Earnings: 2017 through TTM
Sources: New Constructs, LLC and company filings.
Doing the Math: Valuation Implies MAUs Reach Nearly Half the Global Population
With slowing ARPU growth, heavy competition, and highly negative profitability, Pinterest’s business model looks shaky, to say the least. But, the stock price is predicting an entirely different future.
Next, we present just how disconnected this stock’s price is from the company’s fundamentals so that fiduciaries can plainly see why this stock is too risky for them and their clients.
First, Pinterest’s current economic book value, or no growth value, is -$14/share. But, let’s see what the price looks like if we give the firm credit for being able to grow into a profitable enterprise.
We’ll start with using our reverse discounted cash flow (DCF) model to analyze the expectations implied by the current valuation.
To justify its current price of $51/share, Pinterest must immediately:
- Improve its NOPAT margin to 27% (compared to -34% TTM)
- 27% is the midpoint of Twitter (16% in 2018) and Facebook’s (38% in 2017) best-ever NOPAT margins.
- Grow revenue by 26% compounded annually for the next 10 years.
For reference, consensus estimates project Pinterest’s revenue will grow 19% compounded annually over the next decade. See the math behind this reverse DCF scenario.
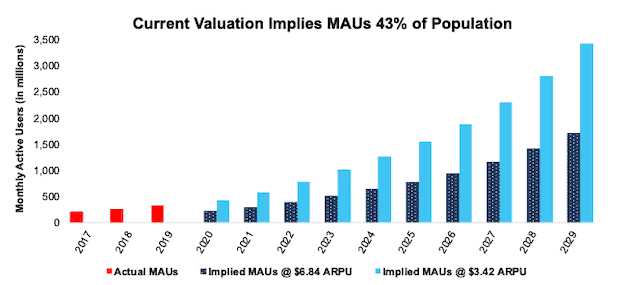
In this scenario, Pinterest would generate nearly $12 billion in revenue 10 years from now, compared to $1.1 billion in 2019. At its annual ARPU[2], $3.42 at the end of 2Q20, this scenario implies the firm would have over 3.4 billion MAUs, or 43% of the current global population.
Here’s another scenario for comparison: we optimistically assume Pinterest can immediately double its ARPU to $6.84, then Pinterest needs just over 1.7 billion MAUs to achieve the revenue implied by its stock price.
In other words, even if Pinterest can double ARPU, it must have 71% more MAUs (10 years from now) than Instagram and nearly 2/3’s the MAUs of Facebook to justify its current stock price. Figure 9 illustrates the staggering level of these expectations compared to current and historical figures.
Figure 9: PINS’s Actual MAUs vs. Implied MAUs
Sources: New Constructs, LLC and company filings.
For further comparison, we compare the MAUs implied by Pinterest’s stock price to some of its largest competitors in Figure 10. At its current ARPU, Pinterest’s stock price implies it will have more MAUs (in 10 years) than Facebook, TikTok, Instagram, Twitter, or YouTube currently have.
Figure 10: PINS’s Valuation Implies MAUs Will Dwarf Competition
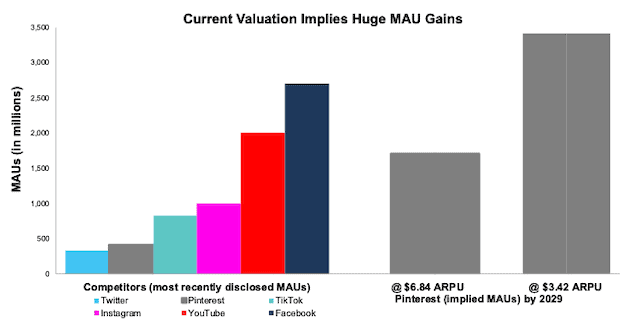
Sources: New Constructs, LLC and company filings.
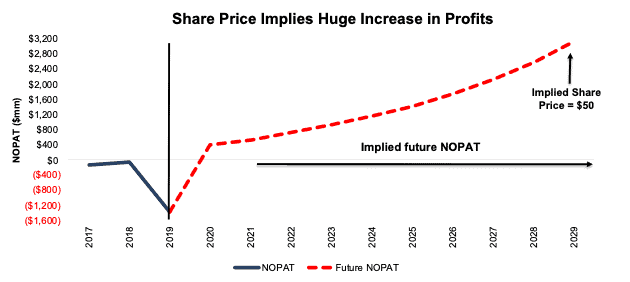
Figure 11 compares the firm’s implied future NOPAT in this scenario to its historical NOPAT. In any scenario worse than this one, Pinterest holds significant downside risk, as we’ll show.
Figure 11: Valuation Implies Pinterest’s NOPAT Will Be More Than eBay
Sources: New Constructs, LLC and company filings.
Significant Downside in a More Realistic Scenario
Given the competitive issues discussed so far, we believe the future cash flow scenario above is highly unlikely, if not impossible for Pinterest to achieve.
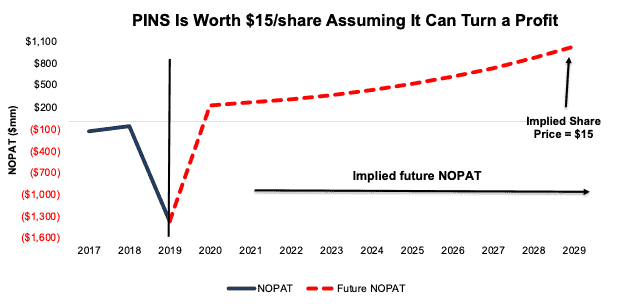
If we lower expectations and assume Pinterest can achieve a 16% NOPAT margin (equal to Twitter’s best ever margin) and grow revenue by 19% compounded annually (equal to longer-term consensus estimates through 2029) for the next decade, the stock is worth only $15/share today – a 69% downside to the current stock price. See the math behind this reverse DCF scenario.
Figure 12 compares the firm’s implied future NOPAT in this scenario to its historical NOPAT.
Figure 12: Pinterest Has Large Downside Risk: DCF Valuation Scenario
Sources: New Constructs, LLC and company filings.
Each of the above scenarios also assumes Pinterest is able to grow revenue, NOPAT and FCF without increasing working capital or fixed assets. This assumption is highly unlikely but allows us to create best-case scenarios that demonstrate how high expectations embedded in the current valuation are. For reference, Pinterest’s invested capital has increased by an average of $551 million (48% of 2019 revenue) over the past two years.
Acquisition Would Be Unwise
Often the largest risk to any bear thesis is what we call “stupid money risk”, which means an acquirer comes in and pays for Pinterest at the current, or higher, share price despite the stock being overvalued. The high-flying valuations of certain tech stocks can be their own worst enemy, as they make the cost of acquisition much higher and the option to build out a standalone platform more attractive to potential suitors.
Nevertheless, it’s possible that a firm could decide to buy Pinterest to boost its position in the social media market.
We think it would be unwise for a larger firm to acquire Pinterest anywhere close to its current valuation. Here’s the math behind our thinking.
Walking Through the Acquisition Math
First, investors need to know that Pinterest has liabilities that make it more expensive than the accounting numbers would initially suggest.
- $2.5 billion in outstanding employee stock options (8% of market cap)
- $225 million in operating leases (<1% of market cap)
After adjusting for these liabilities, we can model multiple purchase price scenarios. For this analysis, we chose Microsoft (MSFT) as a potential acquirer of Pinterest given its recent interest in acquiring TikTok. While we chose Microsoft, analysts can use just about any company to do the same analysis. The key variables are the weighted average cost of capital (WACC) and ROIC for assessing implied stock prices for a deal to create value for the acquirer.
Even in the most optimistic of scenarios, Pinterest is worth less than its current share price.
Figures 13 and 14 show what we think Microsoft should pay for Pinterest to ensure it does not destroy shareholder value. There are limits on how much Microsoft should pay for Pinterest to earn a proper return, given the NOPAT or free cash flows being acquired.
Each implied price is based on a ‘goal ROIC’ assuming different levels of revenue growth. In each scenario, the estimated revenue growth rate is 29% in year one, 35% in year two, and 31% in year three, or equal to consensus. In scenario 1, we assume revenue grows 19% in year four and 14% in year five, or a continuation of consensus estimates. In scenario 2, we assume 31% revenue growth in years four and five to illustrate a better-case scenario where we assume Pinterest could grow revenue even faster with the resources of Microsoft.
We conservatively assume that Microsoft can grow Pinterest’s revenue and NOPAT without spending any working capital or fixed assets beyond the original purchase price. We also assume Pinterest achieves a 20% NOPAT margin, which is greater than Twitter ever achieved, but still below Facebook, and gives credit to Microsoft’s ability to lower costs by moving Pinterest to Microsoft Cloud from Amazon Web Services. For reference, Pinterest’s TTM NOPAT margin is -34%.
Figure 13: Implied Acquisition Prices for Value-Neutral Deal – Scenario 1
Sources: New Constructs, LLC and company filings
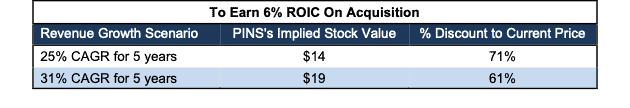
Figure 13 shows the implied values for PINS assuming Microsoft wants to achieve an ROIC on the acquisition that equals its WACC of 6%. This scenario represents the minimum level of performance required not to destroy value. Even if Pinterest can grow revenue by 31% compounded annually for five years and achieve a 20% NOPAT margin, the firm is worth much less than $51/share. It’s worth noting that any deal that only achieves a 6% ROIC would not be accretive to shareholders, as the return on the deal would equal Microsoft’s WACC.
Figure 14: Implied Acquisition Prices to Create Value – Scenario 2
Sources: New Constructs, LLC and company filings
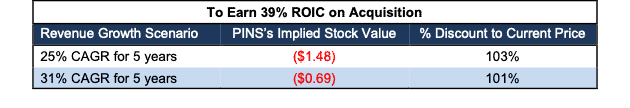
Figure 14 shows the implied values for PINS assuming Microsoft wants to achieve an ROIC on the acquisition that equals 39%, its current ROIC. Acquisitions completed at these prices would be accretive to Microsoft’s shareholders. Even in this best-case growth scenario, the implied value is negative, given Pinterest’s large liabilities noted above. Without significant increases over the margins and/or revenue growth assumed in this scenario, an acquisition of Pinterest at its current price destroys significant shareholder value.
Catalyst: Market Can Remain Irrational, but Missed Expectations Could Send Shares Lower
At the end of March, the consensus estimate for Pinterest’s 2020 earnings was just -$0.10/share. Jump forward to today, and the 2020 consensus estimate has improved to $0.05/share, despite declining ad spending across the industry. Pinterest has only missed earnings expectations once since its IPO, and the stock fell 15% the following day. Considering the stiff competition for ad spending, global uncertainty, and fading COVID-19-induced user growth, another missed earnings report could be on the horizon.
Should ARPU come in lower than anticipated, particularly after falling YoY in 2Q20, or if user growth doesn’t meet expectations, disappointed investors might dump their shares in favor companies with better risk/reward profiles.
Ultimately, with or without an earnings miss, investors could tire of subsidizing the operations of a highly unprofitable business.
What Noise Traders Miss With PINS
These days, fewer investors pay attention to fundamentals and the red flags buried in financial filings. Instead, due to the proliferation of noise traders, the focus tends toward technical trading tends while high-quality fundamental research is overlooked. Here’s a quick summary for noise traders when analyzing Pinterest:
- Most MAU growth comes from unprofitable markets
- ARPU growth is in long-term decline
- Low switching costs caps ARPU potential
- Margins and ROIC are well below most competitors and expenses remain >100% of revenue
- Valuation implies Pinterest’s MAUs will be nearly half the global population
Executive Compensation Largely Tied to Stock Price
In addition to base salaries, Pinterest’s executives earn long-term equity incentive compensation via restricted stock units (RSUs). These RSUs typically vest over a four or five year period.
Without specific performance goals, outside of stock price, which is a problematic performance goal in and of itself, it’s not surprising that the firm’s executive compensation plan has not created shareholder value. Pinterest has generated negative economic earnings in each of the past three years and over the TTM period.
Pinterest should link executive compensation with improving ROIC, which is directly correlated with creating shareholder value, so shareholders’ interests are properly aligned with executives’.
Insider Are Selling and Short Interest Is Notable
Over the past 12 months, insiders have purchased 116 million shares and sold 113 million shares for a net effect of ~3.1 million shares purchased. These sales represent less than 1% of shares outstanding.
There are currently 20.5 million shares sold short, which equates to 3% of shares outstanding and just over one day to cover. The number of shares sold short has increased by 25% since last month, which may indicate investors don’t expect the COVID-19-induced user growth to last much longer.
Critical Details Found in Financial Filings by Our Robo-Analyst Technology
As investors focus more on fundamental research, research automation technology is needed to analyze all the critical financial details in financial filings as shown in the Harvard Business School and MIT Sloan paper,"Core Earnings: New Data and Evidence”.
Below are specifics on the adjustments we make based on Robo-Analyst findings in Pinterest’s 10-Q and 10-K:
Income Statement: we made $42 million of adjustments, with a net effect of removing $18 million in non-operating income (2% of revenue). You can see all the adjustments made to Pinterest’s income statement here.
Balance Sheet: we made $794 million of adjustments to calculate invested capital with a net decrease of $793 million. One of the most notable adjustments was $225 million in operating leases. This adjustment represented 11% of reported net assets. You can see all the adjustments made to Pinterest’s balance sheet here.
Valuation: we made $2.7 billion of adjustments with a net effect of decreasing shareholder value by $2.7 billion. There were no adjustments that increased shareholder value. The most notable adjustment to shareholder value was $2.5 billion in outstanding employee stock options. This adjustment represents 8% of Pinterest’s market cap. See all adjustments to Pinterest’s valuation here.
Unattractive Funds That Hold PINS
The following funds receive our Unattractive rating and allocate significantly to Pinterest.
- Innovator Loup Frontier Tech ETF (LOUP) – 5.8% allocation
- Renaissance IPO ETF (IPO) – 4.9% allocation
- Global X Social Media ETF (SOCL) – 4.7% allocation
- ARK Fintech Innovation ETF (ARKF) – 4.2% allocation
- ARK Next Generation Internet ETF (ARKW) – 3.0% allocation
This article originally published on October 26, 2020.
Disclosure: David Trainer, Kyle Guske II, and Matt Shuler receive no compensation to write about any specific stock, sector, style, or theme.
Follow us on Twitter, Facebook, LinkedIn, and StockTwits for real-time alerts on all our research.
[1] Our core earnings are a superior measure of profits, as demonstrated in Core Earnings: New Data & Evidence a paper by professors at Harvard Business School (HBS) & MIT Sloan. The paper empirically shows that our data is superior to “Operating Income After Depreciation” and “Income Before Special Items” from Compustat, owned by S&P Global (SPGI).
[2] Calculated as TTM revenue of $1.2 billion divided by the average MAUs at the beginning and end of the period (3Q19 through 2Q20).