
We closed the ZEN position on June 29, 2022. A copy of the associated Position Update report is here.
We published an update on PINS on May 23, 2021. A copy of the associated Earnings Update report is here.
We’re reiterating two Danger Zone picks that recently reported calendar 2Q21 earnings. After missing key expectations, in revenue and user growth, these businesses remain miles away from achieving the cash flows implied by their stock prices. Pinterest (PINS: $60/share) and Zendesk (ZEN: $127/share) are in the Danger Zone.
We leverage more reliable fundamental data, proven in The Journal of Financial Economics[1], with qualitative research to highlight these firms whose stocks present poor risk/reward.
Figure 1: Danger Zone Performance: Through 8/6/21

Sources: New Constructs, LLC
Performance represents price performance and is not adjusted for dividends.
Performance measured from the date of publication of the original Danger Zone reports. Dates provided below.
Pinterest Still Has 53%+ Downside
We put Pinterest in the Danger Zone in October 2020 and reiterated our opinion on the stock after 3Q20 earnings in November 2020. Since our original report, the stock has outperformed as a short vs. the S&P 500 by 16%. After poor 2Q21 results, Pinterest continues to look overvalued.
What’s Working for the Business: Revenue grew 125% YoY and 26% quarter-over-quarter and the firm generated positive Core Earnings for just the second time as a public company. Average revenue per user (ARPU), improved from $0.70 in 2Q20 to $1.32 in 2Q21, which was also an improvement from $1.04 in 1Q21.
What’s Not Working for the Business: The growth brought on by COVID-19 shutdowns, during which people were home and on their phones more, looks increasingly unsustainable. Monthly active users (MAUs) badly missed consensus estimates. United States MAUs came in at just 91 million (vs. consensus estimate for 96 million), which is down from 98 million in 1Q21. International MAUs came in at 363 million (vs. consensus estimate for 388 million), which is down from 380 million in 1Q21. Combined, MAUs fell 5% quarter-over-quarter and grew just 9% YoY, which represents the firm’s first single digit YoY monthly active user growth rate as a public company.
Going forward, Pinterest expects weak MAUs to continue. The firm noted that through July 27, 2021, U.S. MAUs were down 7% YoY and total MAUs were up just 5% YoY, a deceleration from 2Q21 results.
Apart from declining MAUs, Pinterest faces a similar challenge as recent Danger Zone pick Snap. In 2Q21, international ARPU was just 7% of United States ARPU. However, international MAUs are nearly 4x United States MAUs. Additionally, international MAUs are the only group that have grown since 3Q20. In other words, Pinterest’s growth is in the least profitable markets, which makes achieving lasting firm-level profitability more difficult.
It’s good to see that Pinterest’s ARPU was up in the most recent quarter, however, we do not see how Pinterest will ever be consistently profitable long-term given the competitive advantages of its primary competitors, who can mimic Pinterest’s offerings easily to their large audiences. New ideas in this space are commoditized almost immediately across all social platforms.
Ultimately, Pinterest’s ARPU improvement is nowhere near what is implied by the stock valuation.
Below, we explain why investors with fiduciary responsibilities should be cautious about investing in Pinterest at anywhere close to the current stock price, even after the big price drop post 2Q21 earnings.
Pinterest Priced to Rival Facebook’s Margins and YouTube’s MAUs: To justify its current price of $60/share, Pinterest must:
- improve its NOPAT margin to 36% (which equals Facebook’s TTM NOPAT margin, compared to Pinterest’s 10% TTM margin), and
- grow revenue at a 24% CAGR through 2028.
In this scenario, Pinterest would generate $9.5 billion in revenue in 2028, which is 4x its TTM revenue. At its current annual ARPU[2], ($5.16 at the end of 2Q21), this scenario implies the firm would have over 1.8 billion MAU’s, or 92% of YouTube’s MAUs and 63% of Facebook’s MAUs in 2Q21. See Figure 2 for comparison of Pinterest’s implied MAUs to its social media peers.
We think its overly optimistic to assume Pinterest will achieve margins on par with Facebook and increase MAUs 400%. In a more realistic scenario, detailed below, the stock has large downside risk.
Figure 2: Pinterest’s Implied MAUs vs. Its Competition[3]
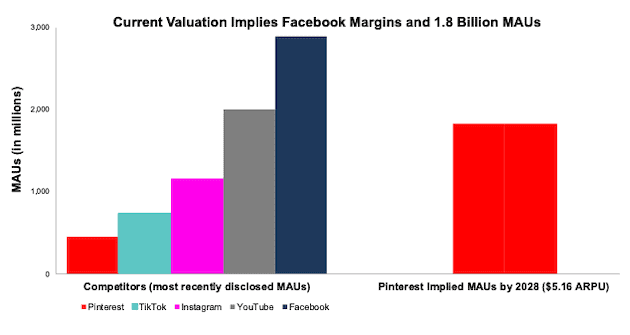
Sources: New Constructs, LLC and company filings
PINS Has 53%+ Downside if we assume Pinterest can match Twitter’s best ever margin and have half the MAUs of YouTube and 1/3 the MAUs of Facebook. In this scenario, we assume Pinterest’s:
- NOPAT margin improves to 16% (Twitter’s best ever margin) and
- revenue grows at consensus rates in 2021, 2022, and 2023 and
- revenue grows 17% a year in 2024-2028 (projected industry CAGR through 2027), then
the stock is worth $28/share today – a 53% downside to the current price. Even if we assume Pinterest can double its ARPU, this scenario implies it has 982 million MAUs, or 216% of its TTM MAUs, 49% of YouTube’s MAUs, and 34% of Facebook’s MAUs. If Pinterest’s growth falters, or even declines, the downside risk in the stock is even higher.
Figure 3 compares the firm’s historical NOPAT and implied NOPATs for the two scenarios we presented to illustrate just how high the expectations baked into Pinterest’s stock price remain. For reference, we include the TTM NOPAT of social media peer Twitter (TWTR).
Figure 3: Pinterest’s Historical vs. Implied NOPAT
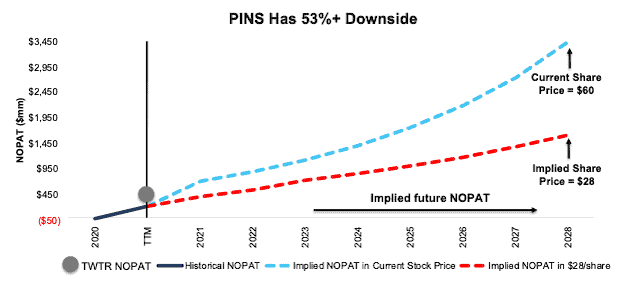
Sources: New Constructs, LLC and company filings.
Each of these scenarios also assumes Pinterest is able to grow revenue, NOPAT, and free cash flow without increasing working capital or fixed assets. This assumption is unlikely but allows us to create best-case scenarios that demonstrate how high expectations embedded in the current valuation are. For reference, Pinterest’s invested capital has grown 23% compounded annually since 2017.
Zendesk Has 81%+ Downside
We first put Zendesk in the Danger Zone in August 2018 and reiterated our opinion in March 2020. Below, we’ll show we what learned from 2Q21 earnings and why Zendesk still holds 81%+ downside risk.
What’s Working for the Business: Top line growth continues, as companies adopt or increase usage of online customer support channels. Revenue grew 29% year-over-year (YoY) in 2Q21, up from 26% YoY in 1Q21. The firm is successfully upselling customers. Its dollar-based net expansion rate, which measures the firm’s ability to increase revenue to existing customers, improved to 120% in 2Q21, up from 114% in 1Q21. The firm also added 50 customers that contribute more than $250k in annual recurring revenue (ARR).
On a non-GAAP basis, every unprofitable company’s favorite way to present its business, Zendesk grew non-GAAP net income from $16.4 million in 2Q20 to $17.1 million in 2Q21. However, this non-GAAP measure removes real costs of doing business, such as $58 million in share-based compensation and $1 million in acquisition-related expenses.
What’s Not Working for the Business: While Zendesk’s top-line growth continues, it did so at a less than expected rate. 2Q21 revenue of $318 million came in below consensus estimates of $321 million. The firm’s land-and-expand strategy, and the elimination of lower tier plans, caused total customers to fall from 112,900 in 1Q21 to 112,300 in 2Q21. Any further decline in customers must be offset by additional revenue from existing customers, else Zendesk’s growth story crashes and burns.
Huge costs continue to drag down any hopes of Zendesk achieving profitability. Sales and marketing over the trailing-twelve months (TTM) are 51% of revenue (up from 50% in 2020), and research & development and general and administrative expenses are 25% and 16% respectively (equal to 2020). Total operating costs, while trending down, are still 114% of revenue in the TTM period.
Zendesk’s customer relationship management and support platform faces direct competition from formidable firms: Salesforce (CRM), ServiceNow (NOW), HubSpot (HUBS), Oracle (ORCL), Microsoft (MSFT), and more. With ample competition and minimal differentiation (online customer support is ubiquitous in today’s internet age), Zendesk has limited pricing power, as illustrated by its worst net operating profit after-tax (NOPAT) margins amongst its competition[4].
Additionally, competition, specifically Salesforce, is not afraid to use its treasure chest of capital as a weapon and operate at a loss for extended periods of time in order to gain market share. With 15x the market cap and already consistent profits, Salesforce is unlikely to allow Zendesk to take any market share.
Not surprisingly, Zendesk’s fundamentals are in bad shape. Core Earnings fell from -$35 million in 2Q20 to -$57 million in 2Q21 and return on invested capital (ROIC) sits at -9% over the TTM. Zendesk has failed to generate positive free cash flow (FCF) since its 2014 IPO, burning through -$1.9 billion over the past five years and -$189 million over the TTM.
Current Price Implies Zendesk Increases Market Share from 2% to 21%: To justify its current price of $127/share, Zendesk must:
- immediately improve NOPAT margin to 5% (which equals Salesforce’s TTM margin, compared to Zendesk’s -13% TTM margin) and
- grow revenue at a 45% CAGR through 2028 (more than 4x projected industry growth).
In this scenario, Zendesk would generate over $20 billion in revenue in 2028, which is 17x its TTM revenue and 90% of Salesforce’s TTM revenue.
This scenario implies Zendesk takes 21% of the CRM market in 2028, up from 2% in 2020, based on Grand View Research’s estimates of the industry. For reference, Salesforce holds 49% of the CRM market based on Grand View Research’s estimate of industry size in 2020.
We think it’s overly optimistic to assume Zendesk will improve margins at such a drastic pace while also growing revenue above consensus and projected industry growth rates. Bulls could argue that Zendesk might be able to raise margins or outpace the industry, but we think it is unrealistic to suggest the firm could do both, and without both, the stock is significantly overvalued.
There’s 81%+ Downside if we assume Zendesk achieves Salesforce-like margins and grows at consensus rates. In this scenario, Zendesk’s:
- NOPAT margin improves to 5% and
- revenue grows at consensus rates in 2021, 2022, and 2023, and
- revenue grows 23% a year from 2023-2028 (continuation of 2023 consensus), then
the stock is worth just $24/share today – an 81% downside to the current price. This scenario still implies that Zendesk increases its market share from 2% in 2020 to 6% in 2028. If Zendesk’s growth falters, it is unable to sign existing customers up for more services, or fails to improve margins as quickly as estimated in this scenario, the downside risk in the stock is even higher.
Figure 4 compares the firm’s historical NOPAT and implied NOPATs for the two scenarios we presented to illustrate just how high the expectations baked into Zendesk’s stock price remain. For reference, we also include the TTM NOPAT of Salesforce and ServiceNow.
Figure 4: Zendesk’s Historical and Implied NOPAT: DCF Valuation Scenarios
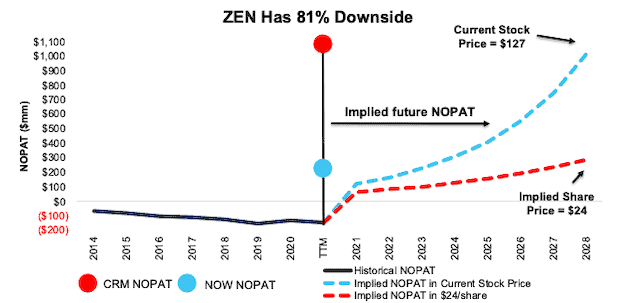
Sources: New Constructs, LLC and company filings
Each of these scenarios also assumes Zendesk is able to grow revenue, NOPAT, and free cash flow without increasing working capital or fixed assets. This assumption is unlikely but allows us to create best-case scenarios that demonstrate how high expectations embedded in the current valuation are. For reference, invested capital has grown 37% compounded annually since 2016.
Other Danger Zone Picks That Recently Reported Earnings
Figure 5 shows other Danger Zone picks that have recently reported their calendar 2Q21 earnings along with their relative performance to the S&P 500.
Figure 5: More Danger Zone Picks That Recently Reported Earnings: Through 8/6/21
| Company | Ticker | Earnings Date | Out (under)performance as Short vs. S&P 500 |
| Lyft | LYFT | 8/3/21 | 97%* |
| Uber | UBER | 8/4/21 | 47%* |
| Beyond Meat | BYND | 8/5/21 | 28% |
| Carvana | CVNA | 8/5/21 | (39%) |
| Dropbox | DBX | 8/5/21 | 10% |
| Shake Shack | SHAK | 8/5/21 | 15% |
| Wayfair | W | 8/5/21 | (576%) |
Sources: New Constructs, LLC
Performance measured from the date of publication of each respective report linked in the table. Performance represents price performance and is not adjusted for dividends.
*Measured from the opening price on the day of each firm’s IPO.
Check out this week’s Danger Zone interview with Chuck Jaffe of Money Life.
This article originally published on August 9, 2021.
Disclosure: David Trainer, Kyle Guske II, and Matt Shuler receive no compensation to write about any specific stock, sector, style, or theme.
Follow us on Twitter, Facebook, LinkedIn, and StockTwits for real-time alerts on all our research.
[1] Our research utilizes our Core Earnings, a more reliable measure of profits, proven by professors at Harvard Business School & MIT Sloan.
[2] Calculated as TTM revenue of $2.2 billion divided by the average MAUs at the beginning and end of the period (3Q20 through 2Q21).
[3] MAUs represent most recently disclosed. Facebook, Pinterest, and YouTube through 2Q21. TikTok as of April 2021. Instagram estimated as of October 2020.
[4] Competition in this analysis includes Microsoft (MSFT), Oracle (ORCL), Nice Ltd (NICE), Nuance Communications (NUAN), ServiceNow (NOW), Salesforce (CRM), HubSpot (HUBS), Pegasystems (PEGA), and LivePerson (LPSN).