
Tesla shareholders approved Elon Musk’s $1 trillion pay package. The compensation plan has the potential to make the world’s richest person also the world’s first trillionaire. While that’s great for Musk, is it really the best use of Tesla’s capital, to mint a trillionaire, when the company is facing significant headwinds?
That’s about as rhetorical as a question can get…
Prudent use of capital doesn’t just apply to executive compensation. Mismanagement of capital can lead to reduced shareholder returns, in the form of reduced or suspended dividends. The most important element of a quality dividend stocks lies in ability to pay that dividend.
If a company’s cash flows aren’t enough to support its dividend payments, it can’t sustain or grow its dividends. On the other hand, companies that generate ample cash flows provide a safe income and have opportunities to further increase their dividends.
Our Dividend Growth Stocks Model Portfolio includes stocks that get an Attractive-or-better rating and companies that not only produce ample free cash flow to support their dividend payments, but also consistently increase their dividend payments over time.
Below is an overview of one of the stocks from the latest edition of our Dividend Growth Model Portfolio. It is not an in-depth Long Idea report, but it will give you a good understanding of how our research combines fundamental research with expectations investing.
We hope you enjoy this free stock pick. Feel free to share this report with friends and colleagues.
We update this Model Portfolio monthly. October’s Dividend Growth Model Portfolio was updated and published for clients on October 30, 2025.
Free Stock Pick: Amdocs, Ltd. (DOX: $84/share)
Amdocs has grown revenue and net operating profit after-tax (NOPAT) by 2% and 4% compounded annually, respectively, since 2014. The company’s NOPAT margin improved from 12% in 2019 to 14% in the trailing-twelve-months (TTM), while invested capital turns fell from 1.0 to 0.9 over the same time. The improvement in NOPAT margin is enough to offset falling invested capital turns and drive return on invested capital (ROIC) from 11% in 2019 to 12% over the TTM.
Figure 1: Amdocs’ Revenue & NOPAT Since 2014
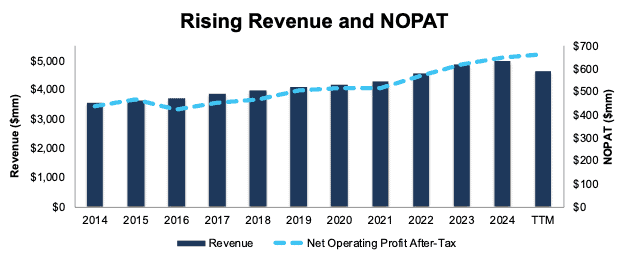
Sources: New Constructs, LLC and company filings
Free Cash Flow Exceeds Dividend Payments
Amdocs has increased its regular, quarterly dividend from $0.29/share in 3Q19 to $0.53/share in 3Q25. The quarterly dividend, when annualized, equals $2.12/share and provides a 2.5% dividend yield.
More importantly, Amdocs’ cumulative free cash flow (FCF) easily exceeds its dividend payments. From 2019 through the first nine months of 2025, Amdocs generated $2.9 billion (29% of current enterprise value) in FCF while paying over $1.3 billion in dividends. See Figure 2.
Figure 2: Amdocs’ FCF vs. Dividends Since 2019

Sources: New Constructs, LLC and company filings
Companies with FCF well above dividend payments provide higher-quality dividend growth opportunities. On the other hand, dividends that exceed FCF cannot be trusted to grow or even be maintained.
DOX Is Undervalued
At its current price of $84/share, DOX has a price-to-economic book value (PEBV) ratio of 1.0. This ratio means the market expects Amdocs’ NOPAT to never grow from TTM levels. This expectation seems overly pessimistic given that Amdocs has grown NOPAT by 5% and 4% compounded annually over the last five and ten years, respectively.
Even if Amdocs’s:
- NOPAT margin remains at 14% (equal to TTM NOPAT margin) through 2034,
- revenue grows at consensus rates in 2025 (-10%), 2026 (4%), and 2027 (5%), and
- revenue grows 2% each year thereafter (equal five-year CAGR) through 2034, then
the stock would be worth $98/share today – a 17% upside. In this scenario, Amdocs’ NOPAT would grow just 3% compounded annually through 2034. Contact us for the math behind this reverse DCF scenario.
Add in Amdocs’ 2.5% dividend yield and a history of dividend growth, and it’s clear why this stock is in October’s Dividend Growth Stocks Model Portfolio.
Critical Details Found in Financial Filings by Our Robo-Analyst Technology
Below are specifics on the adjustments we make based on Robo-Analyst findings in Amdocs’ 6-Ks and 20-Fs:
Income Statement: we made over $200 million in adjustments with a net effect of removing over $150 million in non-operating expense. Clients can see all adjustments made to the income statement on the GAAP Reconciliation tab on the Ratings page on our website.
Balance Sheet: we made over $1 billion in adjustments to calculate invested capital with a net increase of over $300 million. The most notable adjustment was for accumulated goodwill amortization. See all adjustments made to the balance sheet on the GAAP Reconciliation tab on the Ratings page on our website.
Valuation: we made over $1 billion in adjustments with a net decrease of just under $800 million to shareholder value. The most notable adjustment to shareholder value was total debt. See all adjustments to valuation on the GAAP Reconciliation tab on the Ratings page on our website.
This article was originally published on November 7, 2025.
Disclosure: David Trainer, Kyle Guske II, and Hakan Salt receive no compensation to write about any specific stock, style, or theme.
Questions on this report or others? Join our online community and connect with us directly.