
Ten new stocks made our Most Attractive list this month, while three new stocks joined the Most Dangerous list. We published February’s Most Attractive and Most Dangerous stocks to members on February 2, 2023.
January Performance Recap
Our Most Attractive Stocks (+11.4%) outperformed the S&P 500 (+7.1%) from January 5, 2023 through January 31, 2023 by 4.3%. The best-performing large cap stock gained 22% and the best-performing small cap stock was up 29%. Overall, 30 out of 40 Most Attractive stocks outperformed the S&P 500.
Our Most Dangerous Stocks (+10.2%) underperformed the S&P 500 (+7.1%) as a short portfolio from January 5, 2023 through January 31, 2023 by 3.1%. The best-performing large cap short stock fell by 22% and the best-performing small cap short stock rose by 2%. Overall, 19 out of 40 Most Dangerous stocks outperformed the S&P 500 as shorts.
The Most Attractive/Most Dangerous Model Portfolios outperformed as an equal-weighted long/short portfolio by 1.2%.
This report leverages our cutting-edge Robo-Analyst technology to deliver proven-superior[1] fundamental research and support more cost-effective fulfillment of the fiduciary duty of care.
All of our Most Attractive stocks have high (and rising) return on invested capital (ROIC) and low price to economic book value ratio. Most Dangerous stocks have misleading earnings and long growth appreciation periods implied by their market valuations.
Most Attractive Stocks Feature for February: TotalEnergies SE (TTE): $62/share)
TotalEnergies is the featured stock from February’s Most Attractive Stocks Model Portfolio. We made TTE a Long Idea in May 2022. Since then, the stock is up 3% compared to +2% for the S&P 500.
TotalEnergies has grown net operating profit after tax (NOPAT) by 30% compounded annually since 2016. The company’s NOPAT margin has increased from 5% in 2016 to 12% over the trailing-twelve-months (TTM), while invested capital turns rose from 0.9 to 1.2 over the same time. Rising NOPAT margins and invested capital turns drive TotalEnergies’ return on invested capital (ROIC) from 4% in 2016 to 14% over the TTM.
Figure 1: TotalEnergies Revenue and NOPAT Since 2016
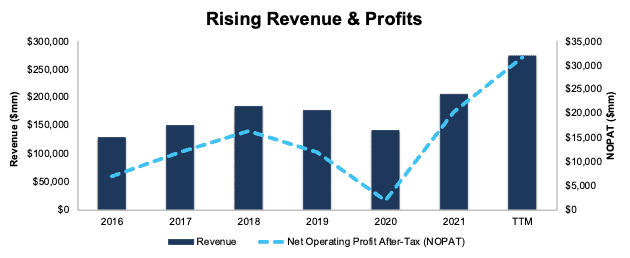
Sources: New Constructs, LLC and company filings
TotalEnergies Is Undervalued
At its current price of $62/share, TTE has a price-to-economic book value (PEBV) ratio of 0.3. This ratio means the market expects TotalEnergies’ NOPAT to permanently decline by 70%. This expectation seems overly pessimistic for a company that has grown NOPAT by 30% compounded annually since 2016.
Even if TotalEnergies’ NOPAT margin falls to its five-year average of 7% (vs. 12% TTM) and revenue grows just 1% compounded annually for the next decade, the stock would be worth $84/share today – a 35% upside. In this scenario, TotalEnergies’ NOPAT would fall 2% compounded annually for the next 10 years. See the math behind this reverse DCF scenario. Should TotalEnergies grow profits more in line with historical levels, the stock has even more upside.
Critical Details Found in Financial Filings by Our Robo-Analyst Technology
Below are the adjustments we made based on Robo-Analyst findings in TotalEnergies’ 6-Ks and 20-Fs:
Income Statement: we made $9.3 billion in adjustments, with a net effect of removing $4.2 billion in non-operating expenses (2% of revenue). Clients can see all adjustments made to TotalEnergies’ income statement on the GAAP Reconciliation tab on the Ratings page on our website.
Balance Sheet: we made $97.0 billion in adjustments to calculate invested capital with a net increase of $22.2 billion. One of the most notable adjustments was $30.3 billion in asset write-downs. This adjustment represents 15% of reported net assets. Clients can see all adjustments made to TotalEnergies’ balance sheet on the GAAP Reconciliation tab on the Ratings page on our website.
Valuation: we made $117.3 billion of adjustments, with a net decrease to shareholder value of $41.7 billion. Apart from total debt, the most notable adjustment to shareholder value was $37.5 billion in excess cash. This adjustment represents 26% of TotalEnergies’ market cap. Clients can see all adjustments to TotalEnergies’ valuation on the GAAP Reconciliation tab on the Ratings page on our website.
Most Dangerous Stocks Feature: Digital Realty Trust (DLR: $113/share)
Digital Realty Trust (DLR) is the featured stock from February’s Most Dangerous Stocks Model Portfolio. We put DLR in the Danger Zone in May 2022. Since then, the stock is down 11% while the S&P 500 is up 3%.
Digital Realty’s economic earnings, the true cash flows of the business, have fallen from $86 million in 2012 to -$1.4 billion over the TTM. Over the same time, Digital Realty’s NOPAT margin has fallen from 29% to 14%, while invested capital turns fell from 0.18 to 0.13. Falling NOPAT margins and invested capital turns drive Digital Realty’s ROIC from 5% in 2012 to 2% over the TTM.
Figure 2: Digital Realty Trust’s Economic Earnings Since 2012
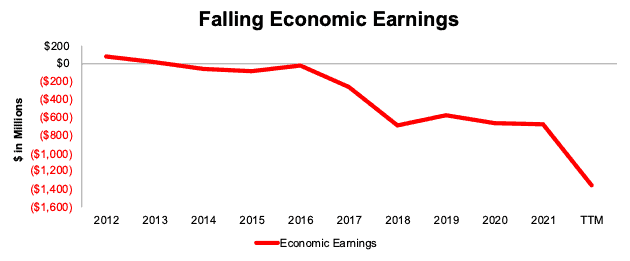
Sources: New Constructs, LLC and company filings
Digital Realty Offers Poor Risk/Reward
Despite its poor fundamentals, Digital Realty’s stock is priced for significant profit growth. Therefore, we believe the stock is overvalued.
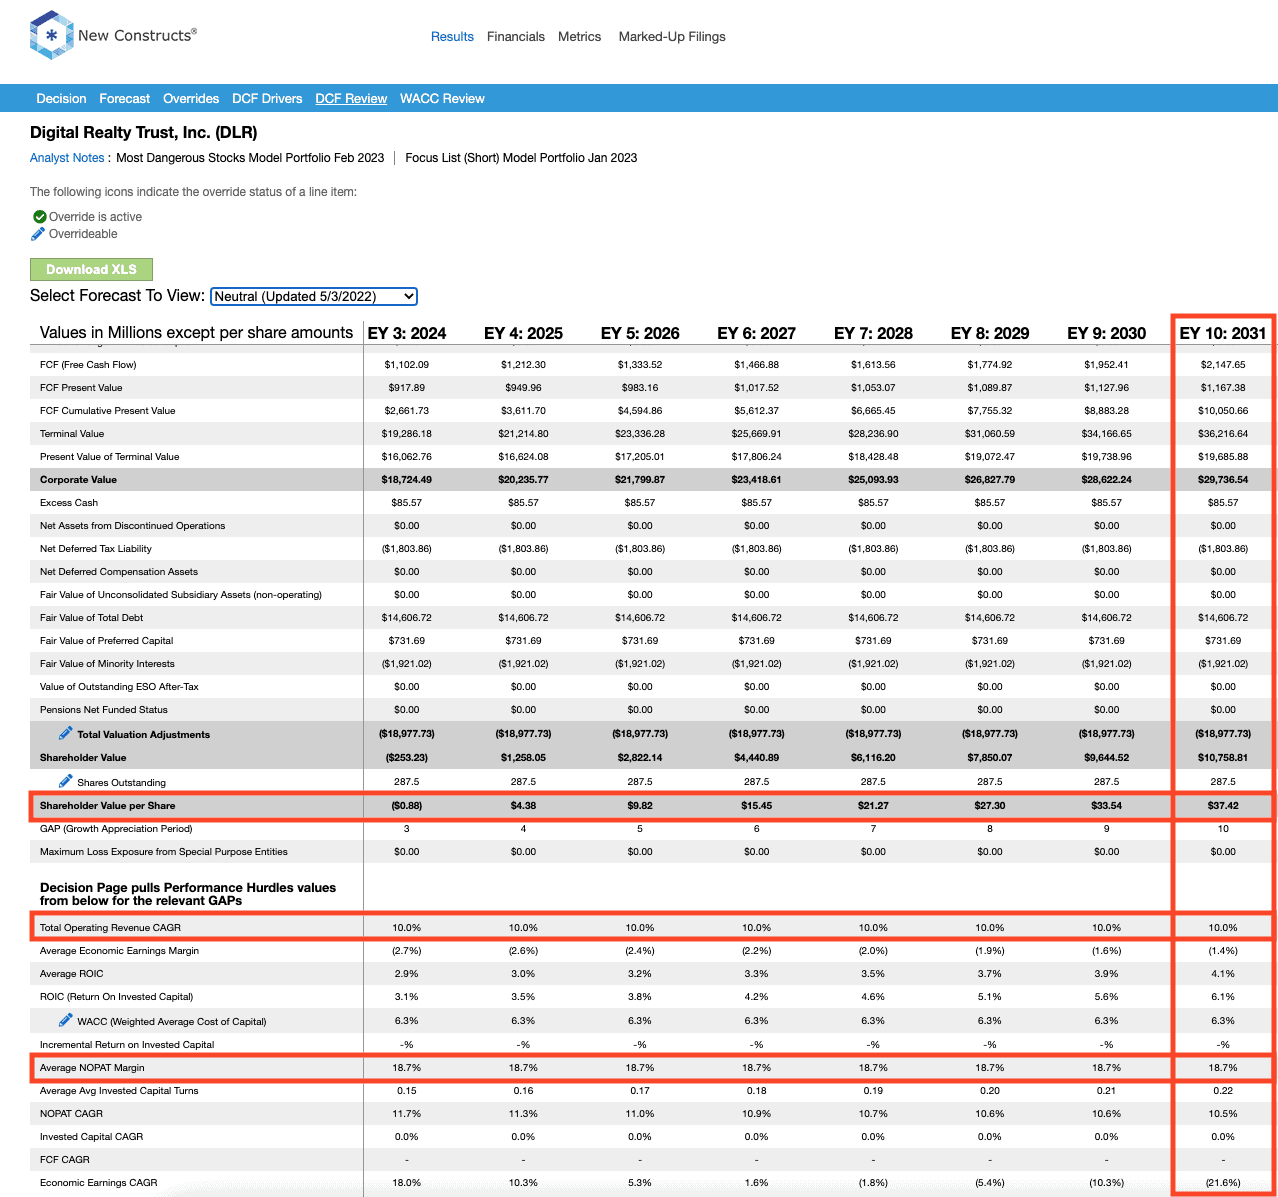
To justify its current price of $113/share, Digital Realty must improve its NOPAT margin to 19% (5-year average, compared to 14% in the TTM) and grow revenue by 17% compounded annually for the next 10 years. For reference, Digital Realty has grown revenue by 14% compounded annually over the past decade. In this scenario, Digital Realty’s NOPAT would grow 18% compounded annually over the next decade. See the math behind this reverse DCF scenario.
Even if Digital Realty improves its NOPAT margin to 19% and grows revenue by 10% compounded annually for the next decade, the stock would be worth no more than $37/share today – a 67% downside to the current stock price. See the math behind this reverse DCF scenario.
Each of these scenarios also assumes Digital Realty can grow revenue, NOPAT, and FCF without increasing working capital or fixed assets. This assumption is unlikely but allows us to create best-case scenarios that demonstrate the high expectations embedded in the current valuation.
Critical Details Found in Financial Filings by Our Robo-Analyst Technology
Below are specifics on the adjustments we made based on Robo-Analyst findings in Digital Realty’s 10-Qs and 10-Ks:
Income Statement: we made $1.9 billion in adjustments, with a net effect of removing $891 million in non-operating income (19% of revenue). Clients can see all adjustments made to Digital Realty’s income statement on the GAAP Reconciliation tab on the Ratings page on our website.
Balance Sheet: we made $1.7 billion in adjustments to calculate invested capital with a net increase of $364 million. One of the most notable adjustments was $659 million in deferred tax assets. This adjustment represented 2% of reported net assets. Clients can see all adjustments made to Digital Realty’s balance sheet on the GAAP Reconciliation tab on the Ratings page on our website.
Valuation: we made $19.1 billion in adjustments, which decreased shareholder value by $19.0 billion. Apart from total debt, the most notable adjustment to shareholder value was $1.9 billion in minority interests. This adjustment represents 6% of Digital Realty’s market cap. Clients can see all adjustments to Digital Realty valuation on the GAAP Reconciliation tab on the Ratings page on our website.
This article was originally published on February 9, 2023.
Disclosure: David Trainer, Kyle Guske II, and Italo Mendonça receive no compensation to write about any specific stock, style, or theme.
Follow us on Twitter, Facebook, LinkedIn, and StockTwits for real-time alerts on all our research.
[1] Our research utilizes our Core Earnings, a more reliable measure of profits, as proven in Core Earnings: New Data & Evidence, written by professors at Harvard Business School (HBS) & MIT Sloan and published in The Journal of Financial Economics.