
This report presents the drivers[1] of economic earnings[2] [return on invested capital (ROIC), NOPAT margin, invested capital turns, and weighted average cost of capital (WACC)] for the NC 2000[3], our All Cap Index, and each of its sectors. This research is based on the latest audited financial data, which is the 1Q21 10-Q for most companies. Price data is as of 5/19/21.
For reference, we analyze the Core Earnings for the entire NC 2000 and each sector in All Cap Index & Sectors: Core Earnings Vs. GAAP Net Income Through 1Q21.
Investors armed with our research enjoy a differentiated and more informed view of the fundamentals and valuations of companies and sectors.
NC 2000 ROIC Falls Year-Over-Year in 1Q21
The NC 2000’s ROIC declined from 7.4% in 1Q20 to 7.1% through 5/19/21, the earliest date all NC 2000 companies provided 1Q21 data. See Figure 1. The Technology, Real Estate, Consumer Non-cyclicals, Basic Materials, and Healthcare sectors saw a year-over-year (YoY) improvement in ROIC, as we’ll show below.
Figure 1: ROIC and WACC for the NC 2000 From March 1999 – 5/19/21[4]
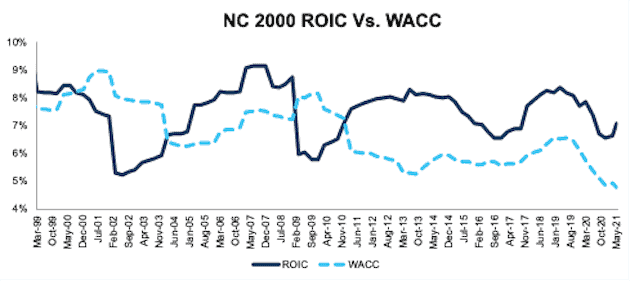
Sources: New Constructs, LLC and company filings.
The May 19, 2021 measurement period uses price data as of that date and incorporates the financial data from 1Q21 10-Qs, as this is the earliest date for which all the 1Q21 10-Qs for the NC 2000 constituents were available.
Ranking the NC 2000 Sectors by Change in ROIC
Figure 2 ranks all 11 NC 2000 sectors by the change in ROIC from 1Q20 to 1Q21.
Figure 2: ROIC for All NC 2000 Sectors
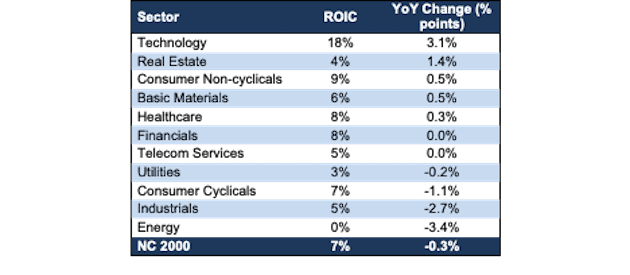
Sources: New Constructs, LLC and company filings.
Financial data incorporates 1Q21 10-Qs.
The Technology sector performed best through the COVID-19 pandemic, as measured by change in ROIC. This trend is not surprising given that the global shutdowns accelerated the enterprise and individual shift to cloud and other software solutions.
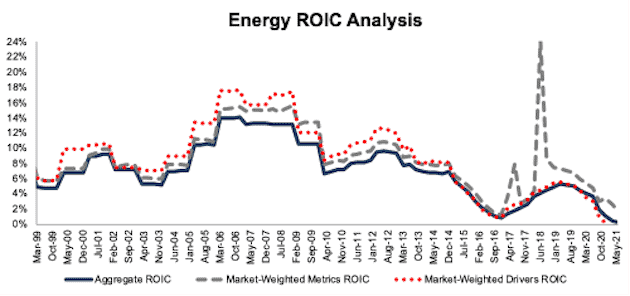
On the flip side, the Energy sector had the largest drop in ROIC from 1Q20 to 1Q21.
Overall, the Technology sector earns the highest ROIC of all sectors, by far, and the Energy sector earns the lowest ROIC.
Details on each of the NC 2000 Sectors
Figures 3-13 compare the ROIC and WACC trends for every sector since March 1999. Appendix I presents the current WACC for each sector.
Appendix II presents the drivers of ROIC: NOPAT margin and invested capital turns for each sector.
Appendix III presents additional ROIC analysis based on different weighting methodologies to adjust for the impact of a firm’s size on its sector and the NC 2000.
Basic Materials
Figure 3 shows the Basic Materials sector ROIC rose from 5.2% in 1Q20 to 5.7% in 1Q21. The Basic Materials sector NOPAT margin rose from 9.0% in 1Q20 to 9.5% in 1Q21, while invested capital turns rose from 0.58 in 1Q20 to 0.60 in 1Q21.
Figure 3: Basic Materials ROIC vs. WACC: March 1999 – 5/19/21
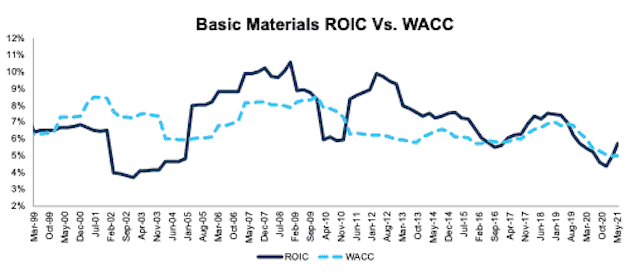
Sources: New Constructs, LLC and company filings.
The May 19, 2021 measurement period uses price data as of that date and incorporates the financial data from 1Q21 10-Qs, as this is the earliest date for which all the 1Q21 10-Qs for the NC 2000 constituents were available.
Consumer Cyclicals
Figure 4 shows the Consumer Cyclicals sector ROIC fell from 7.8% in 1Q20 to 6.7% in 1Q21. The Consumer Cyclicals sector NOPAT margin fell from 7.0% in 1Q20 to 6.3% in 1Q21, while invested capital turns were unchanged at 1.1 from 1Q20 to 1Q21.
Figure 4: Consumer Cyclicals ROIC vs. WACC: March 1999 – 5/19/21
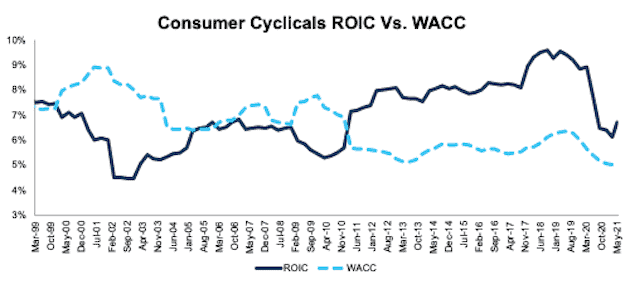
Sources: New Constructs, LLC and company filings.
The May 19, 2021 measurement period uses price data as of that date and incorporates the financial data from 1Q21 10-Qs, as this is the earliest date for which all the 1Q21 10-Qs for the NC 2000 constituents were available.
Consumer Non-cyclicals
Figure 5 shows the Consumer Non-cyclicals sector ROIC rose from 8.1% in 1Q20 to 8.7% in 1Q21. The Consumer Non-cyclicals sector NOPAT margin rose from 5.9% in 1Q20 to 6.2% in 1Q21, while invested capital turns were unchanged at 1.4 from 1Q20 to 1Q21.
Figure 5: Consumer Non-cyclicals ROIC vs. WACC: March 1999 – 5/19/21
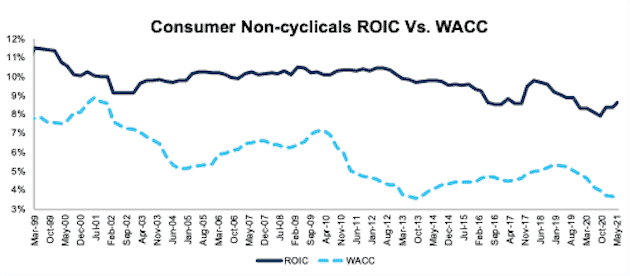
Sources: New Constructs, LLC and company filings.
The May 19, 2021 measurement period uses price data as of that date and incorporates the financial data from 1Q21 10-Qs, as this is the earliest date for which all the 1Q21 10-Qs for the NC 2000 constituents were available.
Energy
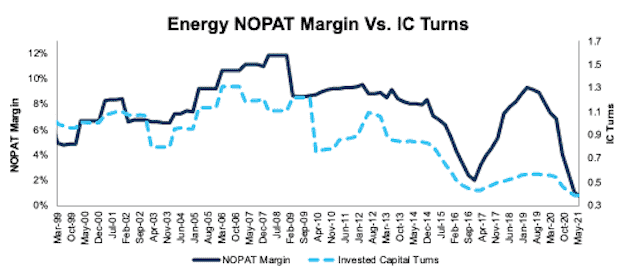
Figure 6 shows the Energy sector ROIC fell from 3.7% in 1Q20 to 0.3% in 1Q21. The Energy sector NOPAT margin fell from 6.9% in 1Q20 to 0.8% in 1Q21, while invested capital turns fell from 0.54 in 1Q20 to 0.38 1Q21.
Figure 6: Energy ROIC vs. WACC: March 1999 – 5/19/21
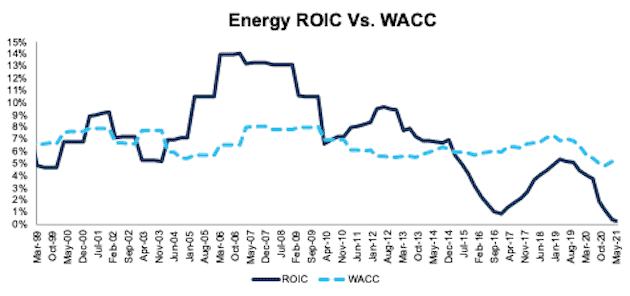
Sources: New Constructs, LLC and company filings.
The May 19, 2021 measurement period uses price data as of that date and incorporates the financial data from 1Q21 10-Qs, as this is the earliest date for which all the 1Q21 10-Qs for the NC 2000 constituents were available.
Financials
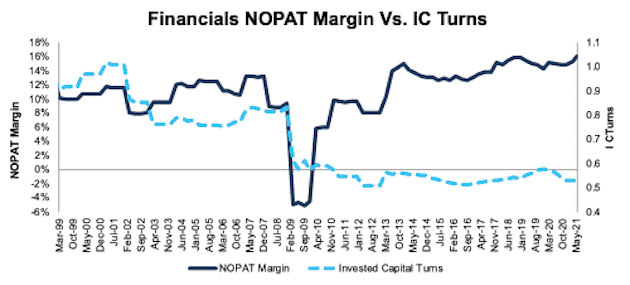
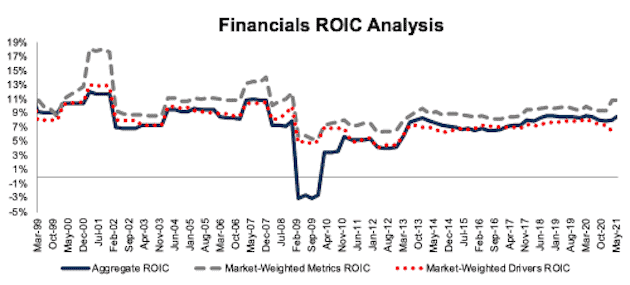
Figure 7 shows the Financials sector ROIC fell from 8.45% in 1Q20 to 8.44% in 1Q21. The Financials sector NOPAT margin rose from 15% in 1Q20 to 16% in 1Q21, while invested capital turns fell from 0.56 in 1Q20 to 0.53 in 1Q21.
Figure 7: Financials ROIC vs. WACC: March 1999 – 5/19/21
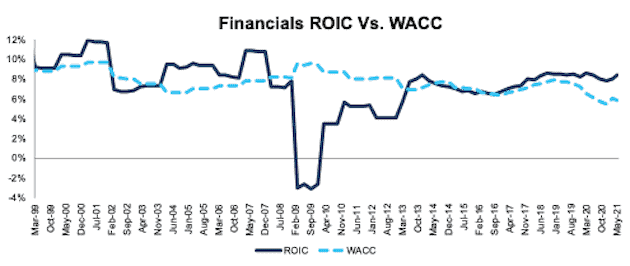
Sources: New Constructs, LLC and company filings.
The May 19, 2021 measurement period uses price data as of that date and incorporates the financial data from 1Q21 10-Qs, as this is the earliest date for which all the 1Q21 10-Qs for the NC 2000 constituents were available.
Healthcare
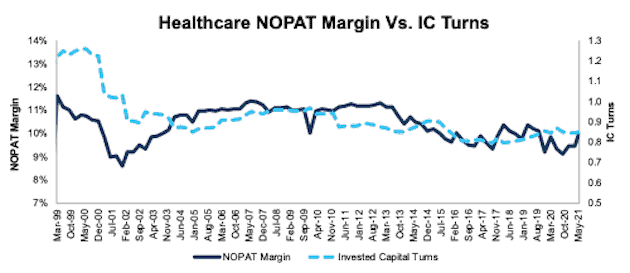
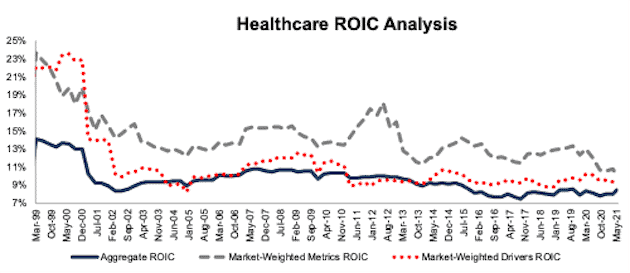
Figure 8 shows the Healthcare sector ROIC rose from 8.1% in 1Q20 to 8.5% in 1Q21. The Healthcare sector NOPAT margin rose from 9.3% in 1Q20 to 10.0% in 1Q21, while invested capital turns fell from 0.87 in 1Q20 to 0.85 in 1Q21.
Figure 8: Healthcare ROIC vs. WACC: March 1999 – 5/19/21
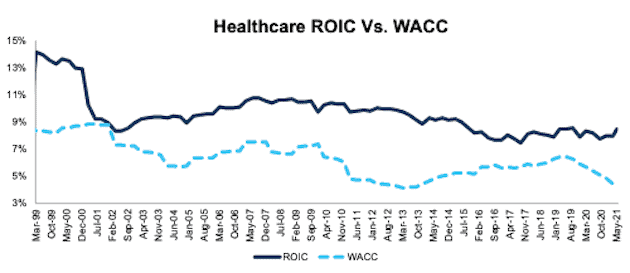
Sources: New Constructs, LLC and company filings.
The May 19, 2021 measurement period uses price data as of that date and incorporates the financial data from 1Q21 10-Qs, as this is the earliest date for which all the 1Q21 10-Qs for the NC 2000 constituents were available.
Industrials
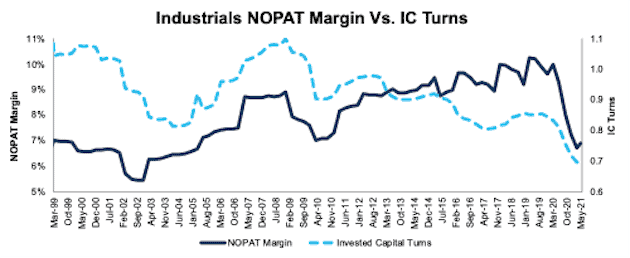
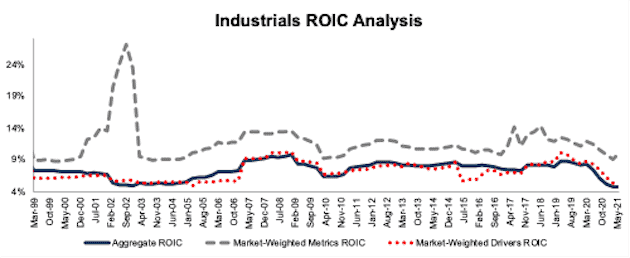
Figure 9 shows the Industrials sector ROIC fell from 7.5% in 1Q20 to 4.8% in 1Q21. The Industrials sector NOPAT margin fell from 9.3% in 1Q20 to 6.9% in 1Q21, while invested capital turns fell from 0.81 in 1Q20 to 0.69 in 1Q21.
Figure 9: Industrials ROIC vs. WACC: March 1999 – 5/19/21
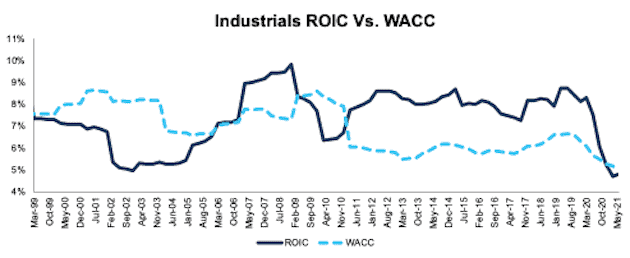
Sources: New Constructs, LLC and company filings.
The May 19, 2021 measurement period uses price data as of that date and incorporates the financial data from 1Q21 10-Qs, as this is the earliest date for which all the 1Q21 10-Qs for the NC 2000 constituents were available.
Real Estate
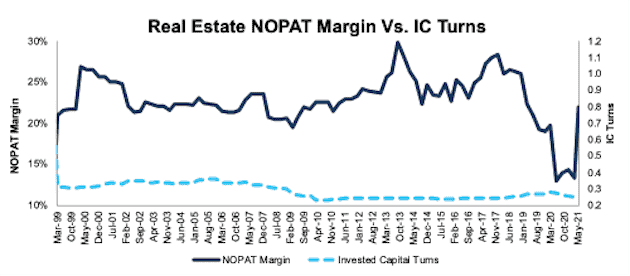
Figure 10 shows the Real Estate sector ROIC rose from 2.9% in 1Q20 to 4.3% in 1Q21. The Real Estate sector NOPAT margin rose from 13% in 1Q20 to 22% in 1Q21, while invested capital turns fell from 0.23 in 1Q20 to 0.20 in 1Q21.
Figure 10: Real Estate ROIC vs. WACC: March 1999 – 5/19/21
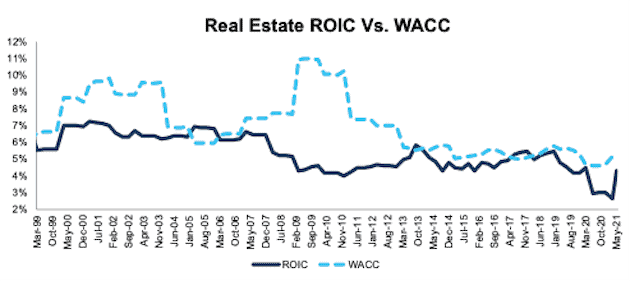
Sources: New Constructs, LLC and company filings.
The May 19, 2021 measurement period uses price data as of that date and incorporates the financial data from 1Q21 10-Qs, as this is the earliest date for which all the 1Q21 10-Qs for the NC 2000 constituents were available.
Technology
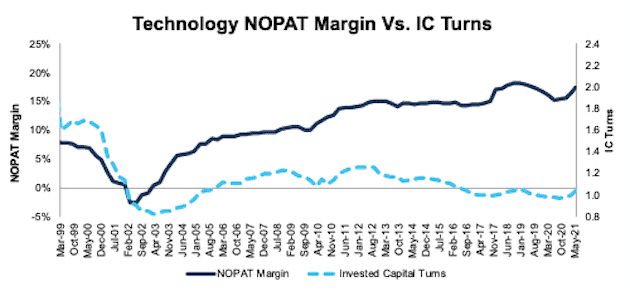
Figure 11 shows the Technology sector ROIC rose from 15% in 1Q20 to 18% in 1Q21. The Technology sector NOPAT margin rose from 15.2% in 1Q20 to 17.3% in 1Q21, while invested capital turns rose from 0.98 in 1Q20 to 1.03 in 1Q21.
Figure 11: Technology ROIC vs. WACC: March 1999 – 5/19/21
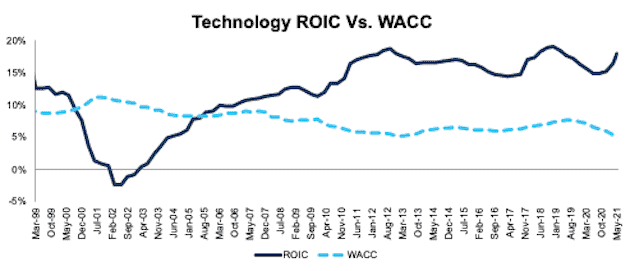
Sources: New Constructs, LLC and company filings.
The May 19, 2021 measurement period uses price data as of that date and incorporates the financial data from 1Q21 10-Qs, as this is the earliest date for which all the 1Q21 10-Qs for the NC 2000 constituents were available.
Telecom Services
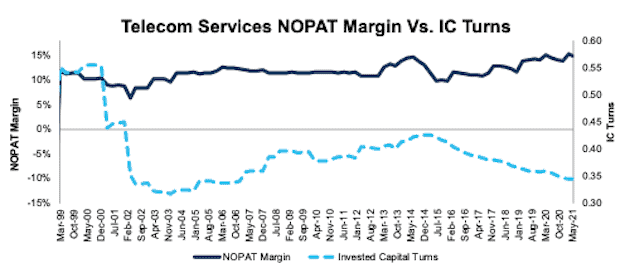
Figure 12 shows the Telecom Services sector ROIC fell from 5.13% in 1Q20 to 5.10% in 1Q21. The Telecom Services sector NOPAT margin rose from 14.4% in 1Q20 to 14.8% in 1Q21, while invested capital turns fell from 0.36 in 1Q20 to 0.34 in 1Q21.
Figure 12: Telecom Services ROIC vs. WACC: March 1999 – 5/19/21
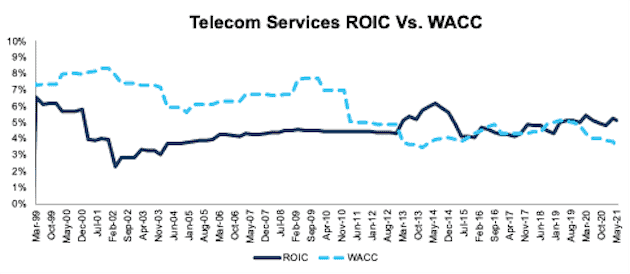
Sources: New Constructs, LLC and company filings.
The May 19, 2021 measurement period uses price data as of that date and incorporates the financial data from 1Q21 10-Qs, as this is the earliest date for which all the 1Q21 10-Qs for the NC 2000 constituents were available.
Utilities
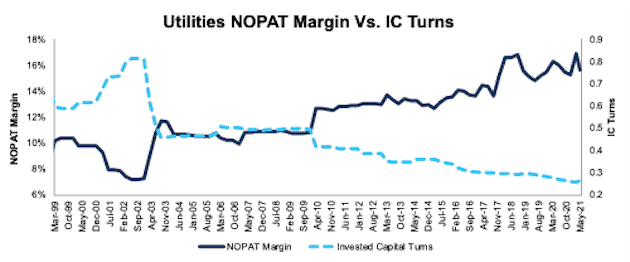
Figure 13 shows the Utilities sector ROIC fell from 3.5% in 1Q20 to 3.3% in 1Q21. The Utilities sector NOPAT margin fell from 16.0% in 1Q20 to 15.6% in 1Q21, while invested capital turns fell from 0.22 in 1Q20 to 0.21 1Q21.
Figure 13: Utilities ROIC vs. WACC: March 1999 – 5/19/21
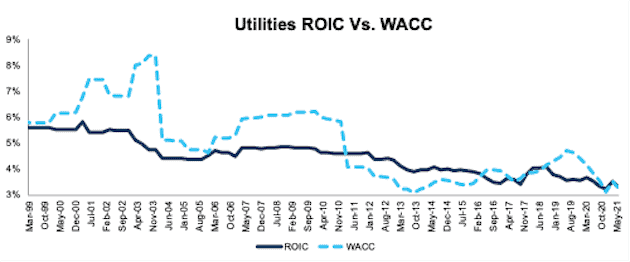
Sources: New Constructs, LLC and company filings.
The May 19, 2021 measurement period uses price data as of that date and incorporates the financial data from 1Q21 10-Qs, as this is the earliest date for which all the 1Q21 10-Qs for the NC 2000 constituents were available.
This article originally published on June 7, 2021.
Disclosure: David Trainer, Kyle Guske II, Alex Sword, and Matt Shuler receive no compensation to write about any specific stock, style, or theme.
Follow us on Twitter, Facebook, LinkedIn, and StockTwits for real-time alerts on all our research.
Appendix I: WACC for Each Sector and NC 2000
This appendix shows the WACC for the NC 2000 and each sector in 1Q21, based on prices as of 5/19/21 and financial data from 1Q21 10-Qs.
We derive the sector and NC 2000 WACCs by solving for WACC in the economic earnings formula:
(ROIC-WACC)*Average Invested Capital = Economic Earnings
translates to
WACC = ROIC - Economic Earnings/Average Invested Capital
We calculate Economic Earnings, NOPAT and Invested Capital according to the Aggregate methodology described in Appendix III.
Figure 14: WACC by Sector – as of 5/19/21
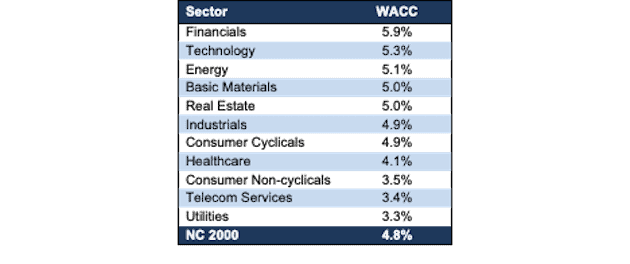
Sources: New Constructs, LLC and company filings.
Prices as of 5/19/21, financial data incorporates 1Q21 10-Qs.
Appendix II: NOPAT Margin and Invested Capital Turns Since 1998
This appendix shows the two key drivers (DuPont model) of ROIC – NOPAT margin and invested capital turns – for each sector going back to March 1999. We sum the individual NC 2000/sector constituent values for revenue, NOPAT, and invested capital to calculate these metrics. We call this approach the “Aggregate” methodology. More methodology details in Appendix III.
Figure 15 ranks all 11 sectors by NOPAT margin based on financial data from 1Q21 10-Qs.
Figure 15: NOPAT Margin by Sector – Financial Data From 1Q21 10-Qs
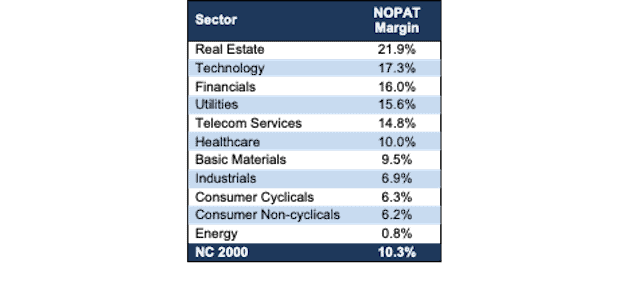
Sources: New Constructs, LLC and company filings.
Financial data from 1Q21 10-Qs.
Figure 16 ranks all 11 sectors by invested capital turns based on financial data from 1Q21 10-Qs.
Figure 16: Invested Capital Turns by Sector – Financial Data From 1Q21 10-Qs
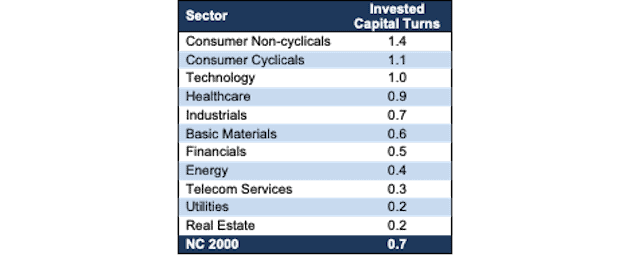
Sources: New Constructs, LLC and company filings.
Financial data from 1Q21 10-Qs.
These two tables show how rare it is for a sector to have both high margins and capital turns. Real Estate, the highest margin sector, has the worst invested capital turns. Consumer Non-cyclicals, the sector with the highest invested capital turns has the second lowest margin. The Technology sector has both high margins and invested capital turns, which is why that sector leads the market in ROIC by a wide margin.
Figures 17-28 compare the NOPAT margin and invested capital turns trends for the NC 2000 and every sector since March 1999.
Figure 17: NC 2000 NOPAT Margin and IC Turns: March 1999 – 5/19/21
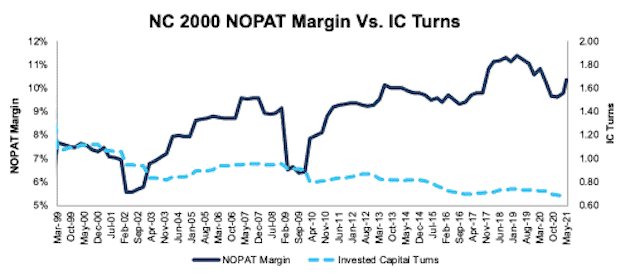
Sources: New Constructs, LLC and company filings.
The May 19, 2021 measurement period uses price data as of that date and incorporates the financial data from 1Q21 10-Qs, as this is the earliest date for which all the 1Q21 10-Qs for the NC 2000 constituents were available.
Figure 18: Basic Materials NOPAT Margin and IC Turns: March 1999 – 5/19/21
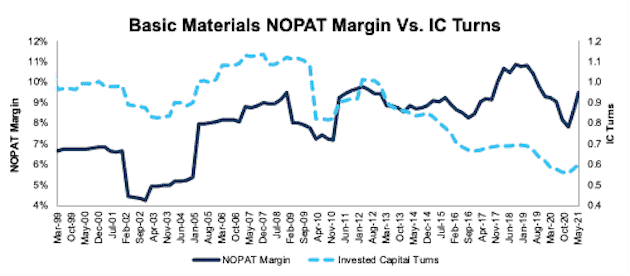
Sources: New Constructs, LLC and company filings.
The May 19, 2021 measurement period uses price data as of that date and incorporates the financial data from 1Q21 10-Qs, as this is the earliest date for which all the 1Q21 10-Qs for the NC 2000 constituents were available.
Figure 19: Consumer Cyclicals NOPAT Margin and IC Turns: March 1999 – 5/19/21
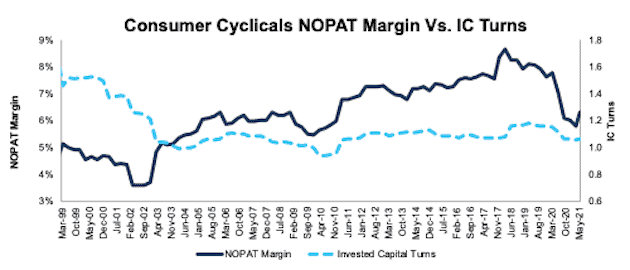
Sources: New Constructs, LLC and company filings.
The May 19, 2021 measurement period uses price data as of that date and incorporates the financial data from 1Q21 10-Qs, as this is the earliest date for which all the 1Q21 10-Qs for the NC 2000 constituents were available.
Figure 20: Consumer Non-Cyclicals NOPAT Margin and IC Turns: March 1999 – 5/19/21
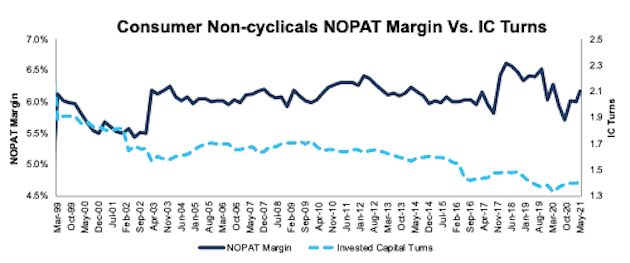
Sources: New Constructs, LLC and company filings.
The May 19, 2021 measurement period uses price data as of that date and incorporates the financial data from 1Q21 10-Qs, as this is the earliest date for which all the 1Q21 10-Qs for the NC 2000 constituents were available.
Figure 21: Energy NOPAT Margin and IC Turns: March 1999 – 5/19/21
Sources: New Constructs, LLC and company filings.
The May 19, 2021 measurement period uses price data as of that date and incorporates the financial data from 1Q21 10-Qs, as this is the earliest date for which all the 1Q21 10-Qs for the NC 2000 constituents were available.
Figure 22: Financials NOPAT Margin and IC Turns: March 1999 – 5/19/21
Sources: New Constructs, LLC and company filings.
The May 19, 2021 measurement period uses price data as of that date and incorporates the financial data from 1Q21 10-Qs, as this is the earliest date for which all the 1Q21 10-Qs for the NC 2000 constituents were available.
Figure 23: Healthcare NOPAT Margin and IC Turns: March 1999 – 5/19/21
Sources: New Constructs, LLC and company filings.
The May 19, 2021 measurement period uses price data as of that date and incorporates the financial data from 1Q21 10-Qs, as this is the earliest date for which all the 1Q21 10-Qs for the NC 2000 constituents were available.
Figure 24: Industrials NOPAT Margin vs. IC Turns: March 1999 – 5/19/21
Sources: New Constructs, LLC and company filings.
The May 19, 2021 measurement period uses price data as of that date and incorporates the financial data from 1Q21 10-Qs, as this is the earliest date for which all the 1Q21 10-Qs for the NC 2000 constituents were available.
Figure 25: Real Estate NOPAT Margin Vs. IC Turns: March 1999 – 5/19/21
Sources: New Constructs, LLC and company filings.
The May 19, 2021 measurement period uses price data as of that date and incorporates the financial data from 1Q21 10-Qs, as this is the earliest date for which all the 1Q21 10-Qs for the NC 2000 constituents were available.
Figure 26: Technology NOPAT Margin Vs. IC Turns: March 1999 – 5/19/21
Sources: New Constructs, LLC and company filings.
The May 19, 2021 measurement period uses price data as of that date and incorporates the financial data from 1Q21 10-Qs, as this is the earliest date for which all the 1Q21 10-Qs for the NC 2000 constituents were available.
Figure 27: Telecom Services NOPAT Margin Vs. IC Turns: March 1999 – 5/19/21
Sources: New Constructs, LLC and company filings.
The May 19, 2021 measurement period uses price data as of that date and incorporates the financial data from 1Q21 10-Qs, as this is the earliest date for which all the 1Q21 10-Qs for the NC 2000 constituents were available.
Figure 28: Utilities NOPAT Margin vs. IC Turns: March 1999 – 5/19/21
Sources: New Constructs, LLC and company filings.
The May 19, 2021 measurement period uses price data as of that date and incorporates the financial data from 1Q21 10-Qs, as this is the earliest date for which all the 1Q21 10-Qs for the NC 2000 constituents were available.
Appendix III: Analyzing ROIC with Different Weighting Methodologies
We derive the metrics above by summing the individual NC 2000/sector constituent values for revenue, NOPAT, and invested capital to calculate the metrics presented. We call this approach the “Aggregate” methodology.
The Aggregate methodology provides a straightforward look at the entire sector, regardless of market cap or index weighting and matches how S&P Global (SPGI) calculates metrics for the S&P 500.
For additional perspective, we compare the Aggregate method for ROIC with two other market-weighted methodologies:
- Market-weighted metrics – calculated by market-cap-weighting the ROIC for the individual companies relative to their sector or the overall NC 2000 in each period. Details:
- Company weight equals the company’s market cap divided by the market cap of the NC 2000/its sector
- We multiply each company’s ROIC by its weight
- NC 2000/Sector ROIC equals the sum of the weighted ROICs for all the companies in the NC 2000/each sector
- Market-weighted drivers – calculated by market-cap-weighting the NOPAT and invested capital for the individual companies in the NC 2000/each sector in each period. Details:
- Company weight equals the company’s market cap divided by the market cap of the NC2000/its sector
- We multiply each company’s NOPAT and invested capital by its weight
- We sum the weighted NOPAT and invested capital for each company in the NC 2000/each sector to determine the NC 2000/sector’s weighted NOPAT and weighted invested capital
- NC 2000/Sector ROIC equals weighted NC 2000/sector NOPAT divided by weighted NC 2000/sector invested capital
Each methodology has its pros and cons, as outlined below:
Aggregate method
Pros:
- A straightforward look at the entire NC 2000/sector, regardless of company size or weighting in any indices.
- Matches how S&P Global calculates metrics for the S&P 500.
Cons:
- Vulnerable to impact of by companies entering/exiting the group of companies, which could unduly affect aggregate values despite the level of change from companies that remain in the group.
Market-weighted metrics method
Pros:
- Accounts for a firm’s size relative to the overall NC 2000/sector and weights its metrics accordingly.
Cons:
- Vulnerable to outsized impact of one or a few companies, as shown below in the Consumer Non-cyclicals sector. This outsized impact tends to occur only for ratios where unusually small denominator values can create extremely high or low results.
Market-weighted drivers method
Pros:
- Accounts for a firm’s size relative to the overall NC 2000/sector and weights its NOPAT and invested capital accordingly.
- Mitigates potential outsized impact of one or a few companies by aggregating values that drive the ratio before calculating the ratio.
Cons:
- Can minimize the impact of period-over-period changes in smaller companies, as their impact on the overall sector NOPAT and invested capital is smaller.
Figures 29-40 compare these three methods for calculating NC 2000 and sector ROICs.
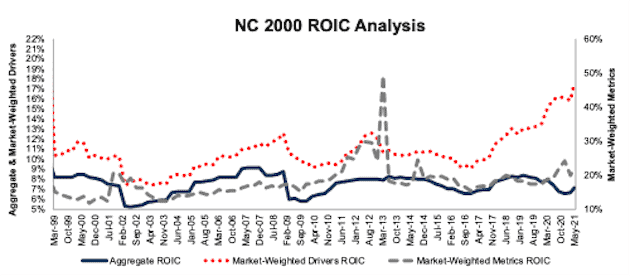
In Figure 29, we chart the market-weighted metrics version of ROIC on its own axis to highlight the differences in the aggregate and market-weighted drivers versions of ROIC.
Note the impact on the market-weighted metrics version of ROIC for the entire NC 2000 from Lorillard (LO) in 2013, when the firm’s ROIC was more than 36,000%.
Figure 29: NC 2000 ROIC Methodologies Compared: March 1999 – 5/19/21
Sources: New Constructs, LLC and company filings.
The May 19, 2021 measurement period uses price data as of that date and incorporates the financial data from 1Q21 10-Qs, as this is the earliest date for which all the 1Q21 10-Qs for the NC 2000 constituents were available.
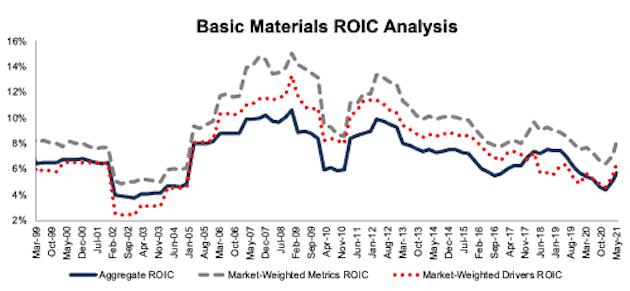
Figure 30: Basic Materials ROIC Methodologies Compared: March 1999 – 5/19/21
Sources: New Constructs, LLC and company filings.
The May 19, 2021 measurement period uses price data as of that date and incorporates the financial data from 1Q21 10-Qs, as this is the earliest date for which all the 1Q21 10-Qs for the NC 2000 constituents were available.
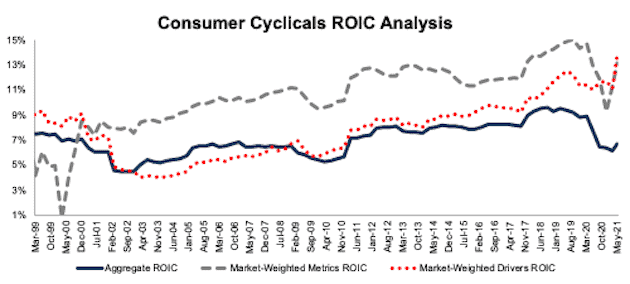
Figure 31: Consumer Cyclicals ROIC Methodologies Compared: March 1999 – 5/19/21
Sources: New Constructs, LLC and company filings.
The May 19, 2021 measurement period uses price data as of that date and incorporates the financial data from 1Q21 10-Qs, as this is the earliest date for which all the 1Q21 10-Qs for the NC 2000 constituents were available.
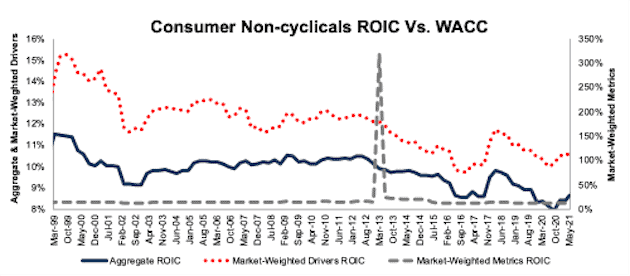
Note the impact on the market-weighted metrics version of ROIC for the Consumer Non-cyclicals sector from Lorillard (LO) in 2013, when the firm’s ROIC was more than 36,000%.
This outlier caused the Consumer Non-cyclicals sector’s ROIC to increase from 15% to 321% in just one period, before falling to 24% one period later.
Figure 32: Consumer Non-cyclicals ROIC Methodologies Compared: March 1999 – 5/19/21
Sources: New Constructs, LLC and company filings.
The May 19, 2021 measurement period uses price data as of that date and incorporates the financial data from 1Q21 10-Qs, as this is the earliest date for which all the 1Q21 10-Qs for the NC 2000 constituents were available.
Figure 33: Energy ROIC Methodologies Compared: March 1999 – 5/19/21
Sources: New Constructs, LLC and company filings.
The May 19, 2021 measurement period uses price data as of that date and incorporates the financial data from 1Q21 10-Qs, as this is the earliest date for which all the 1Q21 10-Qs for the NC 2000 constituents were available.
Figure 34: Financials ROIC Methodologies Compared: March 1999 – 5/19/21
Sources: New Constructs, LLC and company filings.
The May 19, 2021 measurement period uses price data as of that date and incorporates the financial data from 1Q21 10-Qs, as this is the earliest date for which all the 1Q21 10-Qs for the NC 2000 constituents were available. .
Figure 35: Healthcare ROIC Methodologies Compared: March 1999 – 5/19/21
Sources: New Constructs, LLC and company filings.
The May 19, 2021 measurement period uses price data as of that date and incorporates the financial data from 1Q21 10-Qs, as this is the earliest date for which all the 1Q21 10-Qs for the NC 2000 constituents were available.
Figure 36: Industrials ROIC Methodologies Compared: March 1999 – 5/19/21
Sources: New Constructs, LLC and company filings.
The May 19, 2021 measurement period uses price data as of that date and incorporates the financial data from 1Q21 10-Qs, as this is the earliest date for which all the 1Q21 10-Qs for the NC 2000 constituents were available.
Figure 37: Real Estate ROIC Methodologies Compared: March 1999 – 5/19/21
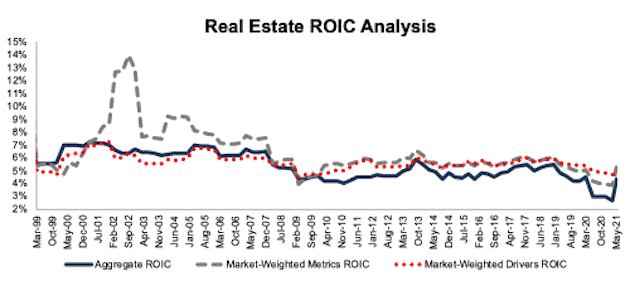
Sources: New Constructs, LLC and company filings.
The May 19, 2021 measurement period uses price data as of that date and incorporates the financial data from 1Q21 10-Qs, as this is the earliest date for which all the 1Q21 10-Qs for the NC 2000 constituents were available.
Figure 38: Technology ROIC Methodologies Compared: March 1999 – 5/19/21
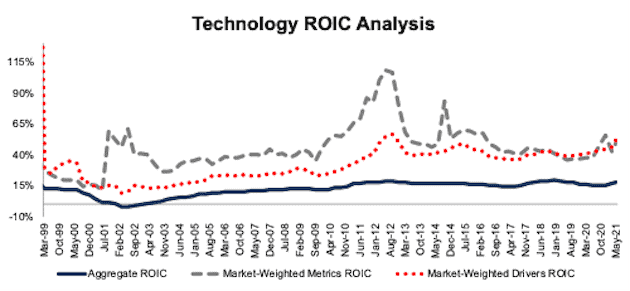
Sources: New Constructs, LLC and company filings.
The May 19, 2021 measurement period uses price data as of that date and incorporates the financial data from 1Q21 10-Qs, as this is the earliest date for which all the 1Q21 10-Qs for the NC 2000 constituents were available.
Figure 39: Telecom Services ROIC Methodologies Compared: March 1999 – 5/19/21
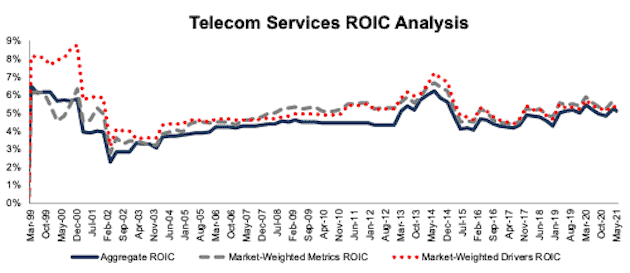
Sources: New Constructs, LLC and company filings.
The May 19, 2021 measurement period uses price data as of that date and incorporates the financial data from 1Q21 10-Qs, as this is the earliest date for which all the 1Q21 10-Qs for the NC 2000 constituents were available.
Figure 40: Utilities ROIC Methodologies Compared: March 1999 – 5/19/21
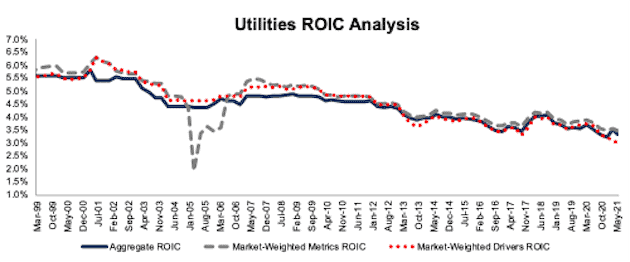
Sources: New Constructs, LLC and company filings.
The May 19, 2021 measurement period uses price data as of that date and incorporates the financial data from 1Q21 10-Qs, as this is the earliest date for which all the 1Q21 10-Qs for the NC 2000 constituents were available.
[1] We calculate these metrics based on SPGI’s methodology, which sums the individual NC 2000 constituent values for NOPAT and invested capital before using them to calculate the metrics. We call this the “Aggregate” methodology. Get more details in Appendix III. See Appendix I for details on how we calculate WACC for the NC 2000 and each of its sectors.
[2] For 3rd-party reviews, including The Journal of Financial Economics, on our more reliable fundamental data and research, click here and here.
[3] The NC 2000 consists of the largest 2000 U.S. companies by market cap in our coverage. Constituents are updated on a quarterly basis (March 31, June 30, September 30, and December 31). We exclude companies that report under IFRS and non-U.S. ADR companies.
[4] We use stock prices from 5/19/21 because that is the date when all the 1Q21 10-Qs for the NC 2000 constituents were available.