
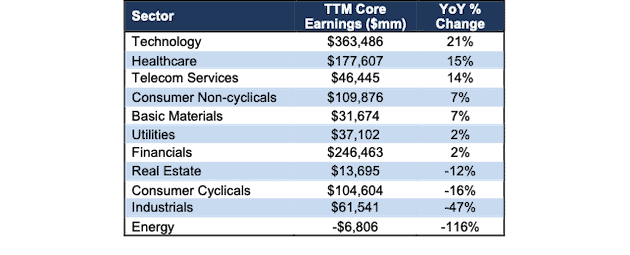
All but four sectors (Real Estate, Consumer Cyclicals, Industrials, and Energy) saw a year-over-year (YoY) rise in Core Earnings[1] in 1Q21. This widespread improvement in Core Earnings is a stark contrast to last quarter, when just four sectors saw a YoY increase in Core Earnings.
This report focuses on the Core Earnings of each S&P 500 sector and highlights which sectors are seeing the biggest rebound from the COVID-19 induced downturn in 2020. The most recent Core Earnings and GAAP net income values are based on the latest audited financial data, which is the calendar 1Q21 10-Q for most companies.
These reports leverage more reliable fundamental data[2] that enables investors to overcome flaws with legacy fundamental datasets. Investors armed with our research enjoy a differentiated and more informed view of the fundamentals and valuations of companies and sectors.
Ranking the Sectors by Core Earnings Growth
Figure 1 ranks all 11 S&P 500 sectors by the change in Core Earnings from 1Q20 to 1Q21[3].
Figure 1: 1Q21 Core Earnings vs. Last year by S&P 500 Sector
Sources: New Constructs, LLC and company filings.
Our Core Earnings analysis is based on aggregated TTM data for the sector constituents.
The Technology sector generates the most Core Earnings by far (nearly 1.5x the next closest sector) and grew Core Earnings by 21% YoY in 1Q21. On the flip side, the Energy sector has the lowest Core Earnings and the largest YoY drop in 1Q21.
Details on the S&P 500 Sectors
Figures 2-12 compare the Core Earnings and GAAP net income trends for every S&P 500 sector since 2004.
Basic Materials
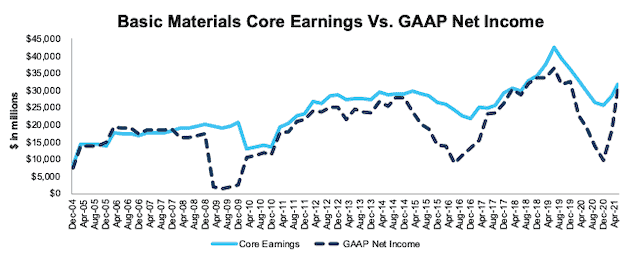
Figure 2 shows Core Earnings for the Basic Materials sector peaked in mid 2019 and, even after rebounding in the last three quarters, remain 25% below the peak. Asset write-downs, which occurred at record levels through the first half of 2020, help explain the large disconnect between Core Earnings and GAAP net income throughout 2020.
Figure 2: Basic Materials Core Earnings Vs. GAAP: 2004 – 1Q21
Sources: New Constructs, LLC and company filings.
Our Core Earnings analysis is based on aggregated TTM data for the sector constituents in each measurement period.
The May 19, 2021 measurement period incorporates the financial data from calendar 1Q21 10-Qs, as this is the earliest date for which all the calendar 1Q21 10-Qs for the S&P 500 constituents were available.
Consumer Cyclicals
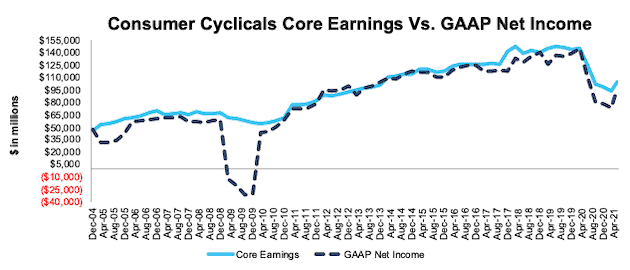
Figure 3 shows that the COVID-19 pandemic impacted the Consumer Cyclicals sector more than the Financial Crisis, when Core Earnings were largely unchanged. Core Earnings for the Consumer Cyclicals sector returned to growth in 1Q21 but remain 28% below 2019, the last reporting period before the COVID-19 pandemic began.
Figure 3: Consumer Cyclicals Core Earnings Vs. GAAP: 2004 – 1Q21
Sources: New Constructs, LLC and company filings.
Our Core Earnings analysis is based on aggregated TTM data for the sector constituents in each measurement period.
The May 19, 2021 measurement period incorporates the financial data from calendar 1Q21 10-Qs, as this is the earliest date for which all the calendar 1Q21 10-Qs for the S&P 500 constituents were available..
Consumer Non-Cyclicals
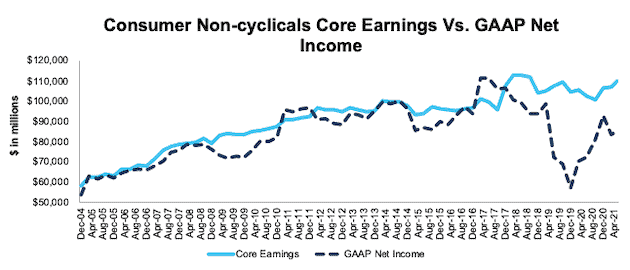
Figure 4 shows Core Earnings for the Consumer Non-Cyclicals sector have consistently risen over time and improved 7% YoY in 1Q21. However, investors looking at GAAP net income would see a much different picture. The drop in GAAP net income in 4Q20 is largely the result of Walmart (WMT) and McKesson (MCK). Walmart reported an $8.4 billion write-down related to disposal of business operations and disclosed $4 billion in incremental cost related to COVID-19 in the MD&A on page 35 of its fiscal 2021 10-K. McKesson (MCK) reported $7.9 billion in claims and litigation charges in its fiscal 2021 10-K. Our Core Earnings remove such unusual, non-operating charges, so investors get more accurate, and less volatile, views of profits.
Figure 4: Consumer Non-Cyclicals Core Earnings Vs. GAAP: 2004 – 1Q21
Sources: New Constructs, LLC and company filings.
Our Core Earnings analysis is based on aggregated TTM data for the sector constituents in each measurement period.
The May 19, 2021 measurement period incorporates the financial data from calendar 1Q21 10-Qs, as this is the earliest date for which all the calendar 1Q21 10-Qs for the S&P 500 constituents were available.
Energy
Figure 5 shows Core Earnings for the Energy sector fell 115% YoY in 1Q21 to levels not seen at any point in the history of our data (which dates to 2004).
Figure 5: Energy Core Earnings Vs. GAAP: 2004 – 1Q21
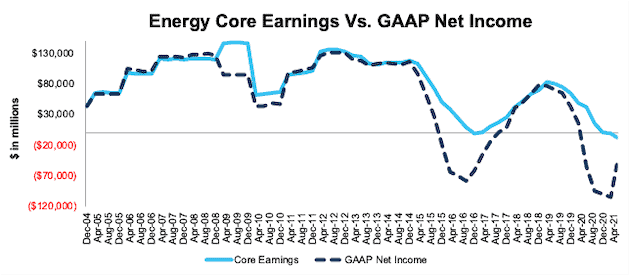
Sources: New Constructs, LLC and company filings.
Our Core Earnings analysis is based on aggregated TTM data for the sector constituents in each measurement period.
The May 19, 2021 measurement period incorporates the financial data from calendar 1Q21 10-Qs, as this is the earliest date for which all the calendar 1Q21 10-Qs for the S&P 500 constituents were available.
Financials
Figure 6 shows Core Earnings for the Financials sector, while still below pre-COVID levels, improved 2% YoY in 1Q21. Overall, Core Earnings held up much better than during the Financial Crisis. The key difference between the two periods, as we noted in our Long Idea on JPMorgan Chase (JPM), is that many banks were the source of the problems that caused the Financial Crisis while playing a key role in the recovery during COVID-19.
Figure 6: Financials Core Earnings Vs. GAAP: 2004 – 1Q21
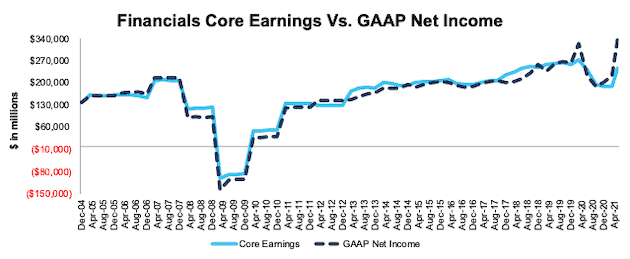
Sources: New Constructs, LLC and company filings.
Our Core Earnings analysis is based on aggregated TTM data for the sector constituents in each measurement period.
The May 19, 2021 measurement period incorporates the financial data from calendar 1Q21 10-Qs, as this is the earliest date for which all the calendar 1Q21 10-Qs for the S&P 500 constituents were available.
Healthcare
Figure 7 shows Core Earnings for the Healthcare sector have consistently increased since 2004 and rose 15% YoY in 1Q21. The consistent rise in demand for healthcare helps drive continued Core Earnings growth.
Figure 7: Healthcare Core Earnings Vs. GAAP: 2004 – 1Q21
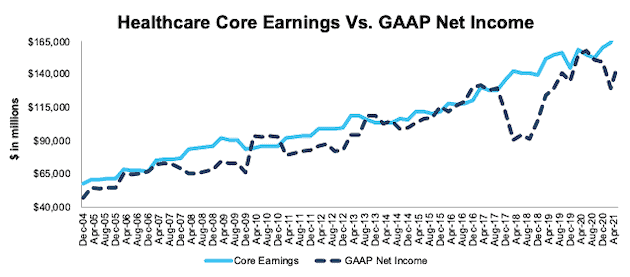
Sources: New Constructs, LLC and company filings.
Our Core Earnings analysis is based on aggregated TTM data for the sector constituents in each measurement period.
The May 19, 2021 measurement period incorporates the financial data from calendar 1Q21 10-Qs, as this is the earliest date for which all the calendar 1Q21 10-Qs for the S&P 500 constituents were available.
Industrials
Figure 8 shows the Industrials sector is particularly impacted by COVID-19, and Core Earnings fell 47% YoY in 1Q21. However, Core Earnings did improve 11% quarter-over-quarter in 1Q21 after falling each of the prior four quarters.
Figure 8: Industrials Core Earnings Vs. GAAP: 2004 – 1Q21
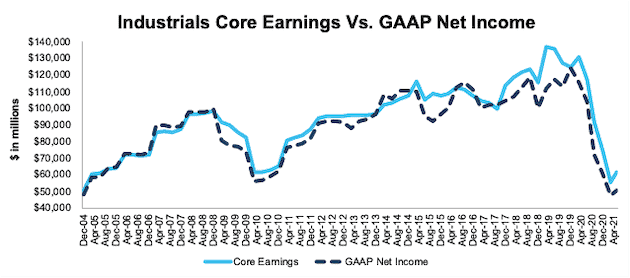
Sources: New Constructs, LLC and company filings.
Our Core Earnings analysis is based on aggregated TTM data for the sector constituents in each measurement period.
The May 19, 2021 measurement period incorporates the financial data from calendar 1Q21 10-Qs, as this is the earliest date for which all the calendar 1Q21 10-Qs for the S&P 500 constituents were available.
Real Estate
Figure 9 shows that after many years of consistent growth, Core Earnings for the Real Estate sector fell 12% YoY in 1Q21.
Figure 9: Real Estate Core Earnings Vs. GAAP: 2004 – 1Q21
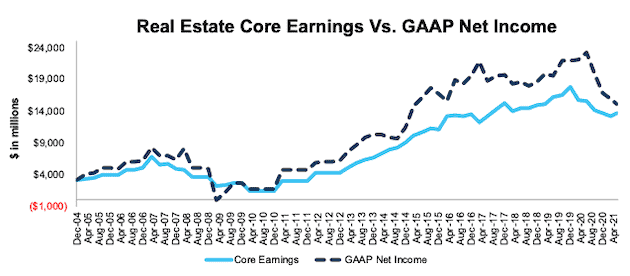
Sources: New Constructs, LLC and company filings.
Our Core Earnings analysis is based on aggregated TTM data for the sector constituents in each measurement period.
The May 19, 2021 measurement period incorporates the financial data from calendar 1Q21 10-Qs, as this is the earliest date for which all the calendar 1Q21 10-Qs for the S&P 500 constituents were available.
Technology
Figure 10 shows that not only did the Technology sector’s Core Earnings rise 21% YoY in 1Q21, but they have consistently risen since December 2004. However, this earnings power remains unevenly distributed. Over the TTM, five of the 77 Technology companies, Apple (AAPL), Microsoft (MSFT), Alphabet (GOOGL), Facebook (FB), and Intel Corporation (INTC) account for 61% of the sector’s total Core Earnings.
Figure 10: Technology Core Earnings Vs. GAAP: 2004 – 1Q21
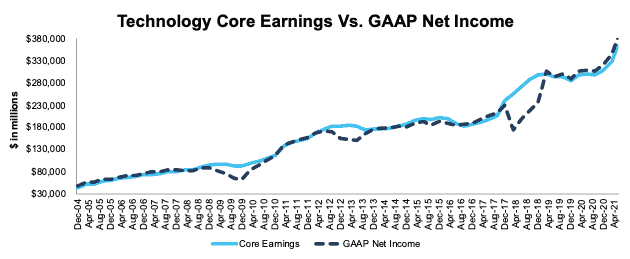
Sources: New Constructs, LLC and company filings.
Our Core Earnings analysis is based on aggregated TTM data for the sector constituents in each measurement period.
The May 19, 2021 measurement period incorporates the financial data from calendar 1Q21 10-Qs, as this is the earliest date for which all the calendar 1Q21 10-Qs for the S&P 500 constituents were available.
Telecom Services
Figure 11 shows Core Earnings for the Telecom Services sector rose 14% YoY in 1Q21, while its 1Q21 GAAP net income fell 44% YoY. This disconnect between Core Earnings and GAAP net income beginning in 2Q20 is driven largely by AT&T (T)’s $15.5 billion write-down of assets and goodwill related to its video business. In total, AT&T’s asset write-downs equaled 33% of the sector’s Core Earnings in 1Q21.
The significant jump in GAAP net income in 2018 comes from the Tax Cuts and Jobs Act. At the time, we identified Verizon (VZ) and AT&T (T) as the biggest winners of tax reform, and in 2017, they recorded nearly $25 billion in combined tax benefits. Note how our Core Earnings adjusts for the anomalous, one-time tax effects.
Figure 11: Telecom Services Core Earnings Vs. GAAP: 2004 – 1Q21
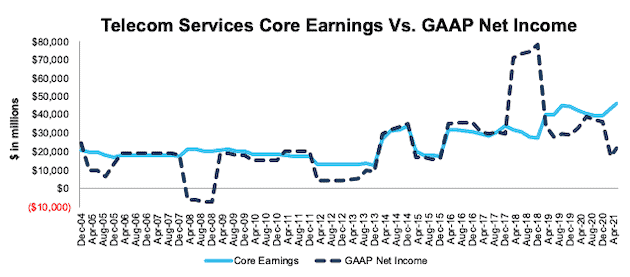
Sources: New Constructs, LLC and company filings.
Our Core Earnings analysis is based on aggregated TTM data for the sector constituents in each measurement period.
The May 19, 2021 measurement period incorporates the financial data from calendar 1Q21 10-Qs, as this is the earliest date for which all the calendar 1Q21 10-Qs for the S&P 500 constituents were available.
Utilities
Figure 12 shows Core Earnings for the Utilities sector improved 2% YoY in 1Q21 and are just 8% below mid-2018 highs.
Figure 12: Utilities Core Earnings Vs. GAAP: 2004 – 1Q21
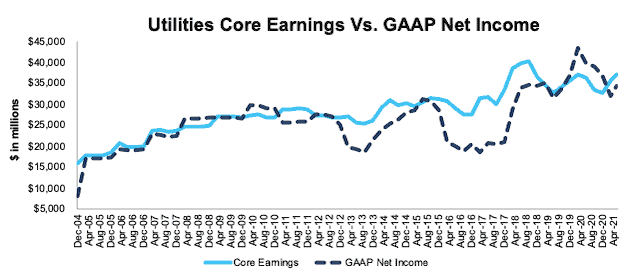
Sources: New Constructs, LLC and company filings.
Our Core Earnings analysis is based on aggregated TTM data for the sector constituents in each measurement period.
The May 19, 2021 measurement period incorporates the financial data from calendar 1Q21 10-Qs, as this is the earliest date for which all the calendar 1Q21 10-Qs for the S&P 500 constituents were available.
This article originally published on May 25, 2021.
Disclosure: David Trainer, Kyle Guske II, Alex Sword and Matt Shuler receive no compensation to write about any specific stock, style, or theme.
Follow us on Twitter, Facebook, LinkedIn, and StockTwits for real-time alerts on all our research.
Appendix: Calculation Methodology
We derive the Core Earnings and GAAP Net Income metrics above by summing the Trailing Twelve Month individual S&P 500 constituent values for Core Earnings and GAAP Net Income in each sector for each measurement period. We call this approach the “Aggregate” methodology.
The Aggregate methodology provides a straightforward look at the entire sector, regardless of market cap or index weighting and matches how S&P Global (SPGI) calculates metrics for the S&P 500.
[1] Only Core Earnings enable investors to overcome the inaccuracies, omissions and biases in legacy fundamental data and research, as proven in Core Earnings: New Data & Evidence, a forthcoming paper in The Journal of Financial Economics written by professors at Harvard Business School (HBS) & MIT Sloan.
[2] Three independent studies prove the superiority of our data, models, and ratings. Learn more here.
[3] May 19, 2021 is earliest date for which all the calendar 1Q21 10-Qs for the S&P 500 constituents were available.