
GAAP earnings remain overstated despite a year-over-year (YoY) rise in Core Earnings for all eleven sectors of the NC 2000[1] through the trailing-twelve-months (TTM), ended 1Q22, just as they did in 2021.
This report is an abridged and free version of All Cap Index & Sectors: Earnings Distortions Flash Warning Signs For Equity Investors, one of our quarterly reports on fundamental market and sector trends.
The full version of the report analyzes Core Earnings[2][3] and GAAP earnings of the NC 2000[4] and each of its sectors. Last quarter’s analysis is here. The full report is available to clients with a Pro or higher membership or can be purchased here.
Core Earnings Are More Reliable than GAAP Earnings
Figure 1 in the full report shows GAAP Earnings for the NC 2000 overstate Core Earnings by far more than before the Financial Crisis. The last time GAAP Earnings exceeded Core Earnings was in the TTM ended June 2007. Not long after, GAAP earnings took a dive.
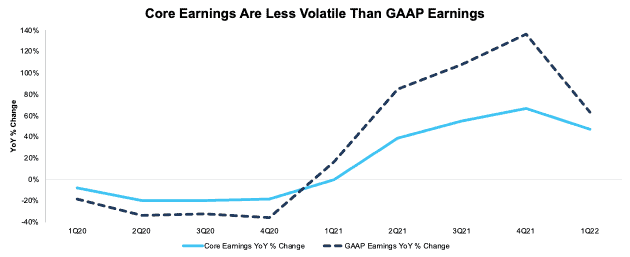
GAAP Earnings rose much faster over the last year, at 63%, compared to 47% for Core Earnings. Since 2020, corporate profits have been much less volatile than indicated by GAAP earnings. For instance:
- In 2020, GAAP earnings fell 36% YoY compared to an 18% fall for Core Earnings.
- In 2021, GAAP earnings rose 136% YoY compared to a 67% rise for Core Earnings.
- In the TTM ended 1Q22, GAAP earnings rose 63% YoY compared to a 47% rise for Core Earnings.
Figure 1: NC 2000 Core Earnings Vs. GAAP Earnings YoY Percent Change: 1Q20 – 1Q22
Sources: New Constructs, LLC and company filings.
Our Core Earnings analysis is based on aggregated TTM data for the sector constituents in each measurement period.
The May 16, 2022 measurement period incorporates the financial data from 1Q22 10-Qs, as this is the earliest date for which all the calendar 1Q22 10-Qs for the NC 2000 constituents were available.
This report leverages our cutting-edge Robo-Analyst technology to deliver proven-superior[5] fundamental research and support more cost-effective fulfillment of the fiduciary duty of care.
GAAP Earnings Widely Overstated at the Individual Company Level[6]
42%, or 830 of the companies in the NC 2000, report GAAP Earnings that overstate Core Earnings for the TTM ended 1Q22. When GAAP Earnings overstate Core Earnings, they do so by an average of 38%, per Figure 2. The overstatement was greater than ten percent for 20% of companies. For comparison, in the TTM ended 2021 the percent of companies that overstate Core Earnings was 40%.
The 830 companies with overstated GAAP earnings make up 52% of the market cap of the NC 2000.
Figure 2: NC 2000 GAAP Earnings Overstated by 38% On Average

Sources: New Constructs, LLC and company filings.
We use Funds from Operations (FFO) for Real Estate companies rather than GAAP Earnings.
Key Details on Select NC 2000 Sectors
The Energy sector saw the largest YoY improvement, $139.2 billion in Core Earnings, which rose from -$3.4 billion in 1Q21 to $135.8 billion in 1Q22.
The Technology sector generates the most Core Earnings, at $486.9 billion, and grew Core Earnings by 30% YoY in 1Q22. On the flip side, the Real Estate sector has the lowest Core Earnings at $36.3 billion, and the Consumer Non-cyclicals sector, at just 9%, had the weakest YoY growth in 1Q22.
Below we highlight the Consumer Cyclicals sector and a stock with some of the most Earnings Distortion (i.e. overstated GAAP earnings) in the sector.
Sample Sector Analysis[7]: Consumer Cyclicals
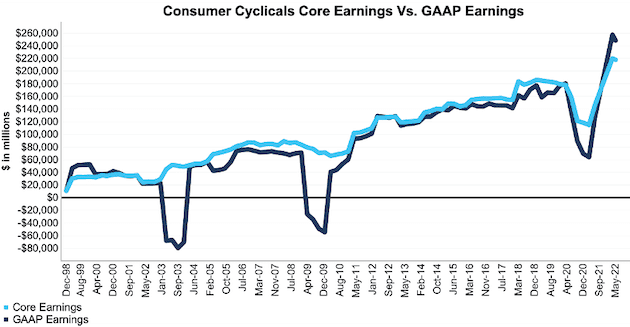
Figure 3 shows Core Earnings for the Consumer Cyclicals sector, at $217.9 billion, rose 49% YoY in 1Q22, while GAAP earnings, at $248.3 billion, rose 96% over the same time.
Figure 3: Consumer Cyclicals Core Earnings Vs. GAAP: 1998 – 1Q22
Sources: New Constructs, LLC and company filings.
Our Core Earnings analysis is based on aggregated TTM data for the sector constituents in each measurement period.
The May 16, 2022 period incorporates the financial data from calendar 1Q22 10-Q, as this is the earliest date for which all the calendar 1Q22 10-Qs for the NC 2000 constituents were available.
GAAP Earnings Overstatement Details: WideOpenWest Inc. (WOW)
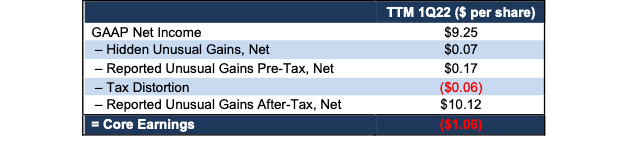
Below, we detail the hidden and reported unusual items that GAAP Earnings miss but that we capture in Core Earnings for WideOpenWest Inc. (WOW). After adjusting for unusual items, we find that WideOpenWest’s Core Earnings of -$87.8 million, or -$1.06/share are much worse than reported GAAP Earnings of $766.6 million, or $9.25/share.
Below, we detail the differences between Core Earnings and GAAP Earnings so readers can audit our research.
Figure 4: WideOpenWest’s GAAP Earnings to Core Earnings Reconciliation
Sources: New Constructs, LLC and company filings.
More details:
Total Earnings Distortion of $10.30/share, which equals $854.4 million, is comprised of the following:
Hidden Unusual Gains, Net = $0.07/per share, which equals $6 million and is comprised of
- $6 million in non-recurring professional fees, M&A integration, and restructuring expense in the TTM period based on
- Reversal of $14 million in 4Q21 as non-recurring fees were disclosed in prior Qs but no longer disclosed in 2021 10-K
- -$8 million in 2Q21
Reported Unusual Gains Pre-Tax, Net = $0.17/per share, which equals $14 million and is comprised of
- $18 million in other income in the TTM period based on
- $9 million in 1Q22
- $7 million in 4Q21
- $2 million in 3Q21
- -$0.4 million loss on sale of assets in 1Q22
- -$3 million loss in the TTM period based on -$3 million loss on early extinguishment of debt in 2021 10-K
Tax Distortion = -$0.06/per share, which equals -$4.9 million
Reported Unusual Gains After-Tax, Net = $10.12/per share, which equals $839 million and is comprised of
- $839 million in income from discontinued operations in the TTM period based on
- $265 million in 4Q21
- $539 million in 3Q21
- $35 million in 2Q21
This article originally published on June 2, 2022.
Disclosure: David Trainer, Kyle Guske II, and Matt Shuler receive no compensation to write about any specific stock, style, or theme.
Follow us on Twitter, Facebook, LinkedIn, and StockTwits for real-time alerts on all our research.
Appendix: Calculation Methodology
We derive the Core Earnings and GAAP Earnings metrics above by summing the trailing-twelve-month individual NC 2000 constituent values for Core Earnings and GAAP Earnings in each sector for each measurement period. We call this approach the “Aggregate” methodology.
The Aggregate methodology provides a straightforward look at the entire sector, regardless of market cap or index weighting and matches how S&P Global (SPGI) calculates metrics for the S&P 500.
[1] The NC 2000 consists of the largest 2000 U.S. companies by market cap in our coverage. Constituents are updated on a quarterly basis (March 31, June 30, September 30, and December 31). We exclude companies that report under IFRS and non-U.S. ADR companies.
[2] Core Earnings enable investors to overcome the flaws in legacy fundamental data and research, as proven in Core Earnings: New Data & Evidence, written by professors at Harvard Business School (HBS) & MIT Sloan for The Journal of Financial Economics.
[3] Based on the latest audited financial data, which is the 10-K for calendar 2021 in most cases.
[4] The NC 2000 consists of the largest 2000 U.S. companies by market cap in our coverage. Constituents are updated on a quarterly basis (March 31, June 30, September 30, and December 31). We exclude companies that report under IFRS and non-U.S. ADR companies.
[5] Our research utilizes our Core Earnings, a more reliable measure of profits, as proven in Core Earnings: New Data & Evidence, written by professors at Harvard Business School (HBS) & MIT Sloan and published in The Journal of Financial Economics.
[6] Overstated companies include all companies with Earnings Distortion >0.1% of GAAP earnings.
[7] The full version of this report provides analysis for all eleven sectors.