
Trailing-twelve-months (TTM) Economic Earnings for the NC 2000[1], our All Cap Index, have been falling quarter-over-quarter (QoQ) since 1Q22. 1Q23 was no different. TTM Economic Earnings in 1Q23 were lower than 4Q22 TTM levels for all but one sector: Financials. Eventually, a higher WACC will likely result in weaker returns on invested capital (ROIC) (see our report on the ROIC trends for the NC 2000 here) as the Fed’s tightening has the intended effect on the economy.
This report is an abridged and free version of All Cap Index & Sectors: Economic Earnings Continue to Fall in 1Q23, one of our quarterly reports on fundamental market and sector trends. The full reports are available to our Professional and Institutional members or can be purchased below.
The full version of this report analyzes the economic earnings[2] (which adjust for unusual items on both the income statement and balance sheet) and GAAP earnings for the NC 2000 and its sectors (last quarter’s analysis is here).
Economic earnings provide a more accurate measure of the true underlying cash flows of businesses than GAAP earnings. Reports on the drivers of economic earnings are here.
This report leverages our cutting-edge Robo-Analyst technology to deliver proven-superior[3] fundamental research and support more cost-effective fulfillment of the fiduciary duty of care.
Economic Earnings Fall Further in 1Q23
TTM Economic Earnings for the NC 2000 fell from $564.3 billion in 4Q22 to $453.5 billion in 1Q23, while TTM GAAP Earnings rose from $1.76 trillion to $1.81 trillion over the same time. TTM Economic Earnings have fallen QoQ in the last five quarters and are nearing levels last seen in 4Q20.
The NC 2000’s falling Economic Earnings are the continuation of a trend we foresaw in our 1Q22 report All Cap Index & Sectors: 1Q22’s Soaring Economic Earnings Aren’t Sustainable. Indeed, a major headwind facing Economic Earnings is a rising weighted average cost of capital (WACC). WACC for the NC 2000 sits at 7.3% in 1Q23, which is up from 7.0% in 4Q22 and 4.8% in 1Q21. Investors can protect themselves by paying closer attention to Economic Earnings, which accounts for the effects of high inflation on a firm’s WACC.
See Figure 1 in the full version of our report for the chart of Economic Earnings vs. GAAP earnings for the NC 2000 from December 1998 through the TTM ended 1Q23.
Key Details on Select NC 2000 Sectors
The Consumer Non-cyclicals sector’s decline in GAAP earnings understates the decline in the sector’s Economic Earnings the least. On the flip side, the Financials sector’s increase in GAAP earnings overstates the decline in Economic Earnings the most.
The Energy sector saw the largest QoQ improvement in TTM Economic Earnings, which rose from $136.6 billion in 4Q22 to 146.6 billion in 1Q23.
The Technology sector’s TTM Economic Earnings fell by 11% QoQ in 1Q23, though it generates the highest TTM Economic Earnings of any sector. On the flip side, the Utilities sector has the lowest TTM Economic Earnings and was one of ten sectors that destroyed shareholder value in 1Q23.
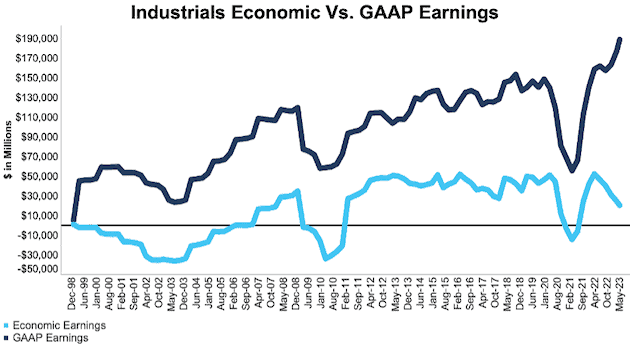
Below, we highlight the Industrials sector which saw economic earnings decline 17% QoQ in 1Q23.
Sample Sector Analysis[4]: Industrials
Figure 1 shows Economic Earnings for the Industrials sector, at $20.5 billion, fell 17% QoQ in 1Q23, while GAAP earnings, at $189.1 billion, rose 7% over the same time.
Figure 1: Industrials Economic Earnings Vs. GAAP: 4Q98 – 1Q23
Sources: New Constructs, LLC and company filings.
Our economic earnings analysis is based on aggregated TTM data for the sector constituents in each measurement period.
The May 15, 2023 period incorporates the financial data from calendar 1Q23 10-Qs, as this is the earliest date for which all of the calendar 1Q23 10-Qs for the NC 2000 constituents were available.
This article was originally published on June 8, 2023.
Disclosure: David Trainer, Kyle Guske II, and Italo Mendonça receive no compensation to write about any specific stock, style, or theme.
Questions on this report or others? Join our Society of Intelligent Investors and connect with us directly.
Appendix: Calculation Methodology
We derive the economic earnings and GAAP earnings metrics above by summing the Trailing Twelve-Month individual NC 2000 constituent values for economic earnings and GAAP earnings in each sector for each measurement period. We call this approach the “Aggregate” methodology.
The Aggregate methodology provides a straightforward look at the entire sector, regardless of market cap or index weighting and matches how S&P Global (SPGI) calculates metrics for the S&P 500.
[1] The NC 2000 consists of the largest 2000 U.S. companies by market cap in our coverage. Constituents are updated on a quarterly basis (March 31, June 30, September 30, and December 31). We exclude companies that report under IFRS and non-U.S. ADR companies.
[2] This report is based on the latest audited financial data available, which is the 1Q23 10-Q in most cases. Price data as of 5/15/23.
[3] Our research utilizes our more of reliable fundamental data, as proven in Core Earnings: New Data & Evidence, written by professors at Harvard Business School (HBS) & MIT Sloan and published in The Journal of Financial Economics.
[4] The full version of this report provides analysis for all eleven sectors.