
Economic earnings for the NC 2000[1], our All Cap Index, fell quarter-over-quarter (QoQ) in 3Q22, a trend that began in 1Q22. Economic earnings decreased for ten out of eleven sectors through the trailing-twelve-months (TTM) ended 3Q22.
This report is an abridged and free version of All Cap Index & Sectors: Economic Earnings Continue to Fall in 3Q22, one of our quarterly reports on fundamental market and sector trends. The full reports are available to those with our new Professional (previously known as Unlimited) and Institutional memberships. Alternatively, the full reports can be purchased below.
The full version of this report analyzes the economic earnings[2] (which adjust for unusual items on both the income statement and balance sheet) and GAAP earnings for the NC 2000 and its sectors (last quarter’s analysis is here).
Economic earnings provide a more accurate measure of the true underlying cash flows of businesses than GAAP earnings. Reports on the drivers of economic earnings are here.
This report leverages our cutting-edge Robo-Analyst technology to deliver proven-superior[3] fundamental research and support more cost-effective fulfillment of the fiduciary duty of care.
Economic Earnings Fall Further in 3Q22
Economic earnings for the NC 2000 fell from $903.8 billion in 2Q22 to $808.7 billion in 3Q22, while GAAP Earnings fell from $2.0 trillion to $1.9 trillion over the same time. Despite falling in 3Q22, economic and GAAP earnings remain near record highs and well above pre-pandemic levels.
The NC 2000’s once soaring economic earnings have fallen quarter-over-quarter in each of the past three quarters, a trend we foresaw in our 1Q22 report All Cap Index & Sectors: 1Q22’s Soaring Economic Earnings Aren’t Sustainable. Indeed, a rising WACC is a major headwind to economic earnings. Inflation boosts GAAP earnings, but these gains are erased in economic earnings by a higher cost of capital.
See Figure 1 in the full version of our report for the chart of Economic Earnings vs. GAAP earnings for the NC 2000 from December 1998 through 3Q22.
Key Details on Select NC 2000 Sectors
The Financial sector’s decline in GAAP Earnings overstates the decline in economic earnings the most. On the flip side, the Energy sector’s increase in GAAP Earnings overstates the increase in economic earnings the most.
Only the Energy sector saw a QoQ improvement in economic earnings, which rose from $85.1 billion in 2Q22 to $132.3 billion in 3Q22.
Despite being the sector with the highest economic earnings, the Technology sector’s economic earnings fell by 9% QoQ in 3Q22. On the flip side, the Utilities sector has the lowest economic earnings and was one of ten sectors that destroyed shareholder value in 3Q22.
Below, we highlight the Industrials sector which saw economic earnings decline 14% QoQ in 3Q22.
Sample Sector Analysis[4]: Industrials
Figure 1 shows economic earnings for the Industrials sector, at $36.5 billion, fell 14% QoQ in 3Q22, while GAAP earnings, at $157.7 billion, were flat over the same time.
Figure 1: Industrials Economic Earnings Vs. GAAP: 4Q98 – 3Q22
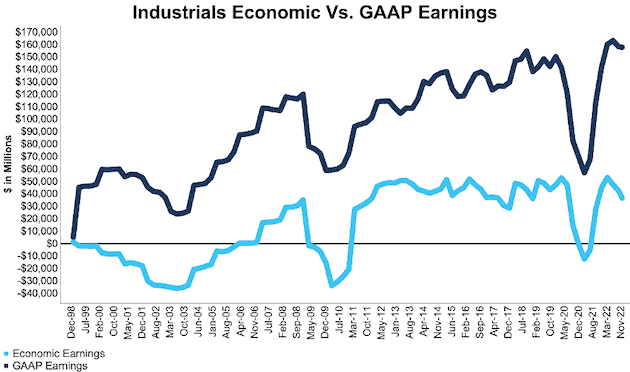
Sources: New Constructs, LLC and company filings.
Our economic earnings analysis is based on aggregated TTM data for the sector constituents in each measurement period.
The November 25, 2022 period incorporates the financial data from calendar 3Q22 10-Q, as this is the earliest date for which all of the calendar 3Q22 10-Qs for the NC 2000 constituents were available.
This article was originally published on December 16, 2022.
Disclosure: David Trainer, Kyle Guske II, Matt Shuler, and Italo Mendonça receive no compensation to write about any specific stock, style, or theme.
Follow us on Twitter, Facebook, LinkedIn, and StockTwits for real-time alerts on all our research.
Appendix: Calculation Methodology
We derive the economic earnings and GAAP earnings metrics above by summing the Trailing Twelve-Month individual NC 2000 constituent values for economic earnings and GAAP earnings in each sector for each measurement period. We call this approach the “Aggregate” methodology.
The Aggregate methodology provides a straightforward look at the entire sector, regardless of market cap or index weighting and matches how S&P Global (SPGI) calculates metrics for the S&P 500.
[1] The NC 2000 consists of the largest 2000 U.S. companies by market cap in our coverage. Constituents are updated on a quarterly basis (March 31, June 30, September 30, and December 31). We exclude companies that report under IFRS and non-U.S. ADR companies.
[2] This report is based on the latest audited financial data available, which is the 3Q22 10-Q in most cases. Price data as of 11/25/22.
[3] Our research utilizes our more of reliable fundamental data, as proven in Core Earnings: New Data & Evidence, written by professors at Harvard Business School (HBS) & MIT Sloan and published in The Journal of Financial Economics.
[4] The full version of this report provides analysis for all eleven sectors.