
2Q22 GAAP earnings for the NC 2000[1] dropped from record highs in 1Q22 and are now lower than Core Earnings for the first time since 1Q21. Six of eleven sectors saw a quarter-over-quarter (QoQ) rise in Core Earnings through the trailing-twelve-months ended 2Q22.
This report is an abridged and free version of All Cap Index & Sectors: GAAP Earnings Fall From Record Highs in 2Q22, one of our quarterly reports on fundamental market and sector trends.
The full version of the report analyzes Core Earnings[2][3] and GAAP earnings of the NC 2000[4] and each of its sectors. Last quarter’s analysis is here. The full report is available to clients with a Pro or higher membership or can be purchased here.
Core Earnings Are More Reliable than GAAP Earnings
Figure 1, taken from the full report, shows GAAP Earnings for the NC 2000 understate Core Earnings for the first time since 1Q21. The drop in GAAP Earnings relative to Core Earnings is similar to the changes observed prior to the Great Recession. The dramatic movement in GAAP earnings overstates the movements in real corporate profits, especially in the volatile economic environment observed since the first quarter of 2020. For instance:
- In 2020, GAAP earnings fell 36% YoY compared to an 18% fall for Core Earnings.
- In 2021, GAAP earnings rose 136% YoY compared to a 67% rise for Core Earnings.
- In the TTM ended 2Q22, GAAP earnings rose 20% YoY compared to a 26% rise for Core Earnings.
Figure 1: NC 2000 Core Earnings Vs. GAAP Earnings YoY Percent Change: 1Q20 – 2Q22
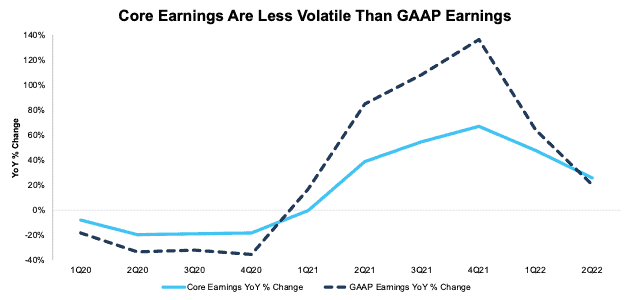
Sources: New Constructs, LLC and company filings.
Our Core Earnings analysis is based on aggregated TTM data for the sector constituents in each measurement period.
The August 12, 2022 measurement period incorporates the financial data from 2Q22 10-Qs, as this is the earliest date for which all the calendar 2Q22 10-Qs for the NC 2000 constituents were available.
This report leverages our cutting-edge Robo-Analyst technology to deliver proven-superior[5] fundamental research and support more cost-effective fulfillment of the fiduciary duty of care.
GAAP Earnings Widely Understated at the Individual Company Level[6]
For the TTM ended 2Q22, 59% of the companies in the NC 2000 reported GAAP Earnings that understated Core Earnings. These 1,183 companies with understated GAAP earnings make up 50% of the market cap of the NC 2000.
When GAAP Earnings understate Core Earnings, they do so by an average of 62%, per Figure 2. The understatement was greater than 10% for 30% of companies. For comparison, in the TTM ended 1Q22 the percent of companies that understate Core Earnings was 56% and made up 44% of the NC 2000 market cap.
Figure 2: NC 2000 GAAP Earnings Understated by 62% On Average

Sources: New Constructs, LLC and company filings.
We use Funds from Operations (FFO) for Real Estate companies rather than GAAP Earnings.
Key Details on Select NC 2000 Sectors
The Energy sector saw the largest QoQ improvement in Core Earnings, which rose from $135.9 billion in 1Q22 to $208.2 billion in 2Q22, or 53%.
The Technology sector generates the most Core Earnings, at $479.6 billion and saw Core Earnings fall 2% QoQ in 2Q22. On the flip side, the Real Estate sector has the lowest Core Earnings at $38.4 billion, and the Financials sector had the largest QoQ decline in 2Q22 at -6%.
Below we highlight the Consumer Cyclicals sector and a stock with some of the most negative Earnings Distortion (i.e. understated GAAP earnings) in the sector.
Sample Sector Analysis[7]: Consumer Cyclicals
Figure 3 shows Core Earnings for the Consumer Cyclicals sector, at $220.4 billion, rose 1% QoQ in 2Q22, while GAAP earnings, at $233.4 billion, fell 6% over the same time.
Figure 3: Consumer Cyclicals Core Earnings Vs. GAAP: 1998 – 2Q22
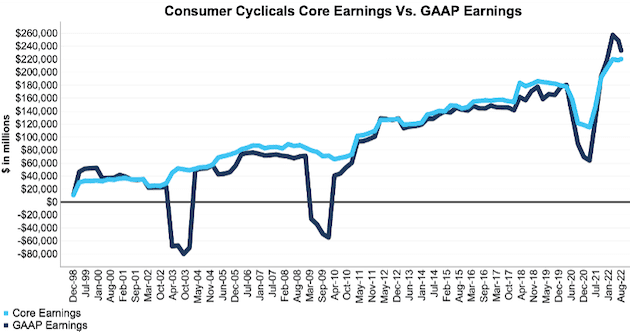
Sources: New Constructs, LLC and company filings.
Our Core Earnings analysis is based on aggregated TTM data for the sector constituents in each measurement period.
The August 12, 2022 period incorporates the financial data from calendar 2Q22 10-Q, as this is the earliest date for which all the calendar 2Q22 10-Qs for the NC 2000 constituents were available.
GAAP Earnings Understatement Details: VF Corporation (VFC)
Below, we detail the hidden and reported unusual items that GAAP Earnings miss but that we capture in Core Earnings for VF Corporation (VFC). After adjusting for unusual items, we find that VF Corporation’s Core Earnings of $1.5 billion, or $3.71/share are much higher than reported GAAP Earnings of $1.0 billion, or $2.58/share.
Below, we detail the differences between Core Earnings and GAAP Earnings so readers can audit our research.
Figure 4: VF Corporation’s GAAP Earnings to Core Earnings Reconciliation: TTM Through 2Q22

Sources: New Constructs, LLC and company filings.
More details:
Total Earnings Distortion of -$1.14/share, which equals -$444 million, is comprised of the following:
Hidden Unusual Expenses, Net = -$1.11/per share, which equals -$436 million and is comprised of
- -$436 million in hidden restructuring expenses in the TTM period based on
- -$4 million in accelerated depreciation in fiscal 1Q23
- -$2 million in severance and employee related benefits in fiscal 1Q23
- -$0.3 million in contract termination and other charges in fiscal 1Q23
- -$410 million reduction in the carrying amount of right-of-use assets in fiscal 4Q22
- -$3 million in accelerated depreciation in fiscal 4Q22
- -$5 million in severance and employee related benefits in fiscal 4Q22
- -$0.7 million in contract termination and other charges in fiscal 4Q22
- -$4 million impairment recorded in lease costs in fiscal 4Q22
- -$0.6 million in accelerated depreciation in fiscal 3Q22
- -$3 million in severance and employee-related benefits in fiscal 3Q22
- -$2 million in accelerated deprecation in fiscal 2Q22
- -$1 million in severance and employee-related benefits in fiscal 2Q22
- $0.5 million in the TTM period based on $0.7 million reduction to allowance for doubtful accounts in fiscal 2022 10-K
Reported Unusual Expenses Pre-Tax, Net = -$0.27/per share, which equals -$105 million and is comprised of
- -$78 million in other expense in the TTM period based on
- -$95 million expense in fiscal 1Q23
- $10 million income in fiscal 4Q22
- -$0.1 million expense in fiscal 3Q22
- $8 million income in fiscal 2Q22
- -$4 million loss on debt extinguishment in fiscal 3Q22
- $24 million contra adjustment for recurring pension costs. These recurring expenses are reported in non-recurring line items, so we add them back and exclude them from Earnings Distortion.
Tax Distortion = $0.25/per share, which equals $96 million
Reported Unusual Expenses After-Tax, Net = <$0.01/per share, which equals $399 thousand and is comprised of
- $0.4 million income from discontinued operations in fiscal 4Q22
This article originally published on August 30, 2022.
Disclosure: David Trainer, Kyle Guske II, Matt Shuler, and Brian Pellegrini receive no compensation to write about any specific stock, style, or theme.
Follow us on Twitter, Facebook, LinkedIn, and StockTwits for real-time alerts on all our research.
Appendix: Calculation Methodology
We derive the Core Earnings and GAAP Earnings metrics above by summing the trailing-twelve-month individual NC 2000 constituent values for Core Earnings and GAAP Earnings in each sector for each measurement period. We call this approach the “Aggregate” methodology.
The Aggregate methodology provides a straightforward look at the entire sector, regardless of market cap or index weighting and matches how S&P Global (SPGI) calculates metrics for the S&P 500.
[1] The NC 2000 consists of the largest 2000 U.S. companies by market cap in our coverage. Constituents are updated on a quarterly basis (March 31, June 30, September 30, and December 31). We exclude companies that report under IFRS and non-U.S. ADR companies.
[2] Core Earnings enable investors to overcome the flaws in legacy fundamental data and research, as proven in Core Earnings: New Data & Evidence, written by professors at Harvard Business School (HBS) & MIT Sloan for The Journal of Financial Economics.
[3] Based on the latest audited financial data, which is the 2Q22 10-Q in most cases. Price data as of 8/12/22.
[4] The NC 2000 consists of the largest 2000 U.S. companies by market cap in our coverage. Constituents are updated on a quarterly basis (March 31, June 30, September 30, and December 31). We exclude companies that report under IFRS and non-U.S. ADR companies.
[5] Our research utilizes our Core Earnings, a more reliable measure of profits, as proven in Core Earnings: New Data & Evidence, written by professors at Harvard Business School (HBS) & MIT Sloan and published in The Journal of Financial Economics.
[6] Understated companies include all companies with Earnings Distortion <-0.1% of GAAP earnings.
[7] The full version of this report provides analysis for all eleven sectors.