
This report updates the trailing-twelve-months (TTM) PEBV ratio for the NC 2000 and all sectors as 11/14/23.
This report is a free and abridged version of All Cap Index & Sectors: Price-to-Economic Book Value Ratio Update for 3Q23, one of our quarterly reports on fundamental market and sector trends. The full reports are available to our Professional and Institutional members or can be purchased below.
The full version of this report analyzes[1],[2] the trailing PEBV ratio for the NC 2000[3], our All Cap Index, and its sectors (last quarter’s analysis is here) over the last twenty years.
This report leverages our cutting-edge Robo-Analyst technology to deliver proven-superior[4] fundamental research and support more cost-effective fulfillment of the fiduciary duty of care.
NC 2000 Trailing PEBV Vs. Last Quarter
The trailing PEBV ratio compares the NC 2000’s expected future profits (as reflected in its price) to its economic book value as of 11/14/23. The NC 2000’s current PEBV ratio implies the profits (NOPAT) of its constituents will increase dramatically from the TTM ended 3Q23 NOPAT levels.
See Figure 1 in the full version of our report for the chart of the PEBV ratio for the NC 2000 and each of its sectors from December 2004 through 11/14/23.
Key Details on Select NC 2000 Sectors
Only the Energy sector trades below its economic book value. The Energy sector has the lowest trailing PEBV ratio among the eleven All Cap Index sectors based on prices as of 11/14/23 and financial data from 3Q23 10-Qs.
A trailing PEBV ratio of 0.8 means the market expects the Energy sector’s profits to decline by 20% from TTM ended 3Q23 levels. On the flip side, investors expect the Utilities and Real Estate sectors to improve profits more than any other NC 2000 sectors.
Below, we highlight the Healthcare sector.
Sample Sector Analysis[5]: Healthcare: Trailing PEBV Ratio = 2.0
Figure 1 shows the trailing PEBV ratio for the healthcare sector rose from 8/15/23 to 11/14/23.
Figure 1: Healthcare Trailing PEBV Ratio: December 1998 – 11/14/23
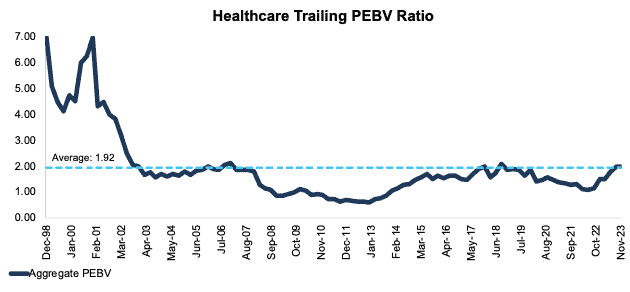
Sources: New Constructs, LLC and company filings.
The November 14, 2023 measurement period uses price data as of that date and incorporates the financial data from 3Q23 10-Qs, as this is the earliest date for which all of the 3Q23 10-Qs for the NC 2000 constituents were available.
Figure 2 compares the trends for market cap and economic book value for the Healthcare sector since 1998. We sum up the individual NC 2000/sector constituent values for market cap and economic book value. We call this approach the “Aggregate” methodology, and it matches S&P Global’s (SPGI) methodology for these calculations.
Figure 2: Healthcare Market Cap & Economic Book Value: December 1998 – 11/14/23
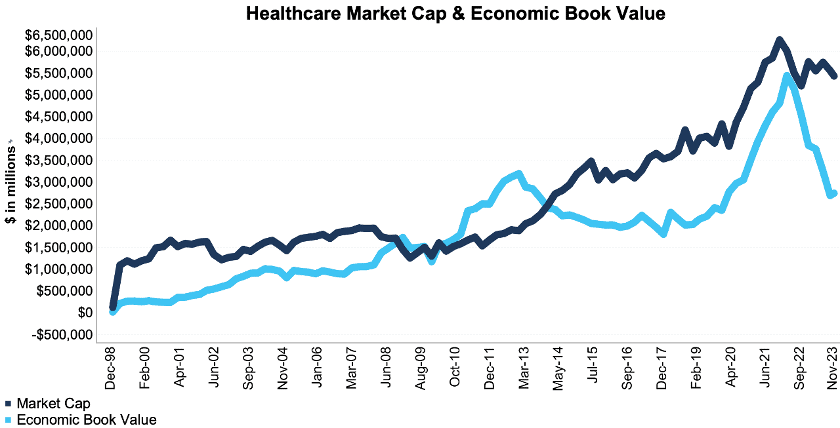
Sources: New Constructs, LLC and company filings.
The November 14, 2023 measurement period uses price data as of that date and incorporates the financial data from 3Q23 10-Qs, as this is the earliest date for which all of the 3Q23 10-Qs for the NC 2000 constituents were available.
The Aggregate methodology provides a straightforward look at the entire NC 2000/sector, regardless of firm size or index weighting, and matches how S&P Global (SPGI) calculates metrics for the S&P 500.
For additional perspective, we compare the Aggregate method for trailing PEBV ratio with two other market-weighted methodologies. Each method has its pros and cons, which are detailed in the Appendix.
Figure 3 compares these three methods for calculating the Healthcare sector’s trailing PEBV ratios.
Figure 3: Healthcare Trailing PEBV Ratio Methodologies Compared: December 1998 – 11/14/23
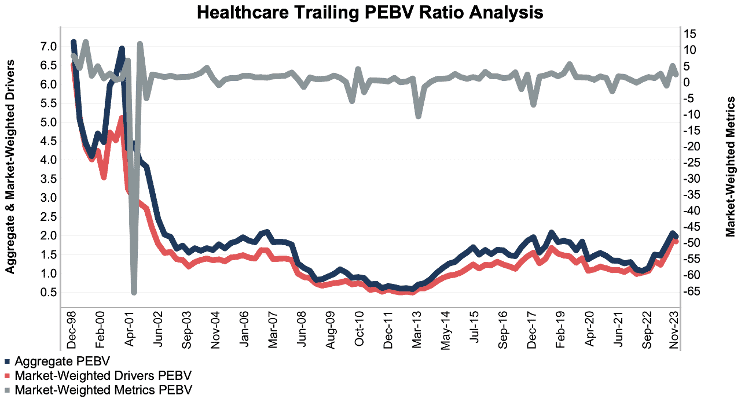
Sources: New Constructs, LLC and company filings.
The November 14, 2023 measurement period uses price data as of that date and incorporates the financial data from 3Q23 10-Qs, as this is the earliest date for which all of the 3Q23 10-Qs for the NC 2000 constituents were available.
This article was originally published on December 6, 2023.
Disclosure: David Trainer, Kyle Guske II, Italo Mendonça, and Hakan Salt receive no compensation to write about any specific stock, style, or theme.
Questions on this report or others? Join our Society of Intelligent Investors and connect with us directly.
Appendix: Analyzing Trailing PEBV Ratio with Different Weighting Methodologies
We derive the metrics above by summing the individual NC 2000/sector constituent values for market cap and economic book value to calculate trailing PEBV ratio. We call this approach the “Aggregate” methodology.
The Aggregate methodology provides a straightforward look at the entire NC 2000/sector, regardless of firm size or index weighting, and matches how S&P Global (SPGI) calculates metrics for the S&P 500.
For additional perspective, we compare the Aggregate method for trailing PEBV ratio with two other market-weighted methodologies. These market-weighted methodologies add more value for ratios that do not include market values, e.g. ROIC and its drivers, but we include them here, nonetheless, for comparison:
- Market-weighted metrics – calculated by market-cap-weighting the trailing PEBV ratio for the individual companies relative to their sector or the overall NC 2000 in each period. Details:
- Company weight equals the company’s market cap divided by the market cap of the NC 2000 or its sector
- We multiply each company’s trailing PEBV ratio by its weight
- NC 2000/Sector trailing PEBV ratio equals the sum of the weighted trailing PEBV ratios for all the companies in the NC 2000/sector
- Market-weighted drivers – calculated by market-cap-weighting the market cap and economic book value for the individual companies in each sector in each period. Details:
- Company weight equals the company’s market cap divided by the market cap of the NC 2000 or its sector
- We multiply each company’s market cap and economic book value by its weight
- We sum the weighted market cap and weighted economic book value for each company in the NC 2000/each sector to determine the NC 2000 or sector’s weighted market cap and weighted economic book value
- NC 2000/Sector trailing PEBV ratio equals weighted NC 2000/sector market cap divided by weighted NC 2000/sector economic book value
Each methodology has its pros and cons, as outlined below:
Aggregate method
Pros:
- A straightforward look at the entire NC 2000/sector, regardless of company size or weighting.
- Matches how S&P Global calculates metrics for the S&P 500.
Cons:
- Vulnerable to impact of companies entering/exiting the group of companies, which could unduly affect aggregate values. Also susceptible to outliers in any one period.
Market-weighted metrics method
Pros:
- Accounts for a firm’s market cap relative to the NC 2000/sector and weights its metrics accordingly.
Cons:
- Vulnerable to outlier results from a single company disproportionately impacting the overall trailing PEBV ratio.
Market-weighted drivers method
Pros:
- Accounts for a firm’s market cap relative to the NC 2000/sector and weights its size and economic book value accordingly.
- Mitigates the disproportionate impact of outlier results from one company on the overall results.
Cons:
- More susceptible to large swings in market cap or economic book value (which can be impacted by changes in WACC) period over period, particularly from firms with a large weighting in the NC 2000/Sector.
[1] We calculate these metrics based on S&P Global’s (SPGI) methodology, which sums individual NC 2000 constituent values for market cap and economic book value before using them to calculate the metrics. We call this the “Aggregate” methodology. Get more details in Appendices I and II.
[2] Based on latest available audited financial data, which is the 3Q23 10-Q in most cases. Price data is as of 11/14/23. QoQ analysis is based on the change since last quarter’s report.
[3] The NC 2000 consists of the largest 2000 U.S. companies by market cap in our coverage. Constituents are updated on a quarterly basis. We exclude companies that report under IFRS and non-U.S. ADR companies.
[4] Our research utilizes our Core Earnings, a more reliable measure of profits, as proven in Core Earnings: New Data & Evidence, written by professors at Harvard Business School (HBS) & MIT Sloan and published in The Journal of Financial Economics.
[5] The full version of this report provides analyses for all eleven sectors.