
Trailing-twelve-month (TTM) return on invested capital (ROIC) for the NC 2000 increased quarter-over-quarter (QoQ) in 4Q22 and was higher than 3Q22 TTM levels. Four out of eleven NC 200 sectors saw a QoQ rise in ROIC in 4Q22. The increase in ROIC comes from a small improvement in both net operating profit after tax (NOPAT) margins (4 basis points), and invested capital turns.
This report is an abridged and free version of All Cap Index & Sectors: ROIC Rebounds in 4Q22, one of our quarterly reports on fundamental market and sector trends. The full reports are available to our Professional and Institutional members or can be purchased below.
The full version of this report analyzes[1],[2] the drivers of economic earnings [ROIC, NOPAT margin, invested capital turns, and weighted average cost of capital (WACC)] for the NC 2000, our All Cap Index, and each of its sectors (last quarter’s analysis available here).
This report leverages our cutting-edge Robo-Analyst technology to deliver proven-superior[3] fundamental research and support more cost-effective fulfillment of the fiduciary duty of care.
NC 2000 ROIC Rises in 4Q22
The NC 2000’s ROIC rose from 9.2% in 3Q22 to 9.3% in 4Q22. The NC 2000’s NOPAT margin remained flat at 11.7% in 4Q22, while invested capital turns rose from 0.78 to 0.79 over the same time.
Some key observations:
We’ve previously noted the “record” return on invested capital of 2Q22 was a mirage and that the bullish trend in ROIC could reverse soon. Though we’ve not seen that reversal yet, numerous companies have noted margins will be pressured in 2023, which could drive ROIC lower. This trend could worsen if there’s a recession in 2023.
TTM WACC for the NC 2000 has now increased QoQ for seven consecutive quarters and could continue moving higher as the Federal Reserve sticks to its plan to increase rates further. The rising cost of capital and high- profile collapse of Silicon Valley Bank threatens investor confidence in the viability of many weaker companies, several of which we’ve highlighted in our Zombie Stocks reports.
Beneath the surface, performance by sector is all over the map. Per Figure 2, some sectors saw ROIC rise while others saw it fall. Digging deeper and looking at the drivers of ROIC, NOPAT margins and invested capital turns, we see wildly different results in different sectors.
This variance signals a lot of churn at the company level, which we expect will weed out many weaker companies in the months ahead. Silicon Valley Bank, Signature Bank, and FTX are among the first to fail, and they will not be the last.
Key Details on Select NC 2000 Sectors
The Energy sector performed best in the fourth quarter of 2022 as measured by change in ROIC, with its ROIC rising 72 basis points from 3Q22.
The biggest loser in the fourth quarter was the Basic Materials sector, with its ROIC falling 105 basis points from 3Q22.
Below, we highlight the Consumer Non-cyclicals sector, which saw an 8 bps decline QoQ in ROIC in 4Q22.
Sample Sector Analysis[4]: Consumer Non-cyclicals
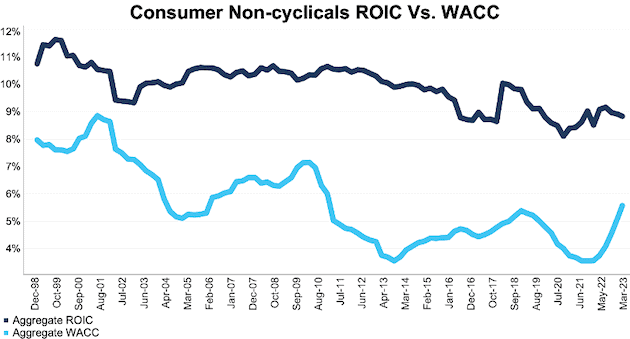
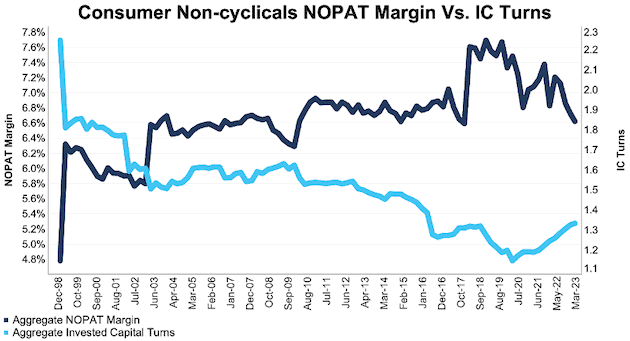
Figure 1 shows the Consumer Non-cyclicals sector ROIC fell from 8.9% in 3Q22 to 8.8% in 4Q22. The Consumer Non-cyclicals sector NOPAT margin fell from 6.7% in 3Q22 to 6.6% in 4Q22, while invested capital turns remained flat QoQ at 1.33 in 4Q22.
Figure 1: Consumer Non-cyclicals ROIC vs. WACC: Dec 1998 – 3/8/23
Sources: New Constructs, LLC and company filings.
The March 8, 2023 measurement period uses price data as of that date for our WACC calculation and incorporates the financial data from 2022 10-Ks for ROIC, as this is the earliest date for which all of the 2022 10-Ks for the NC 2000 constituents were available.
Figure 2 compares the trends in NOPAT margin and invested capital turns for the Consumer Non-cyclicals sector since December 1998. We sum up the individual NC 2000/sector constituent values for revenue, NOPAT, and invested capital to calculate these metrics. We call this approach the “Aggregate” methodology.
Figure 2: Consumer Non-cyclicals NOPAT Margin and IC Turns: Dec 1998 – 3/8/23
Sources: New Constructs, LLC and company filings.
The March 8, 2023 measurement period uses price data as of that date for our WACC calculation and incorporates the financial data from 2022 10-Ks for ROIC, as this is the earliest date for which all of the 2022 10-Ks for the NC 2000 constituents were available.
The Aggregate methodology provides a straightforward look at the entire sector, regardless of market cap or index weighting and matches how S&P Global (SPGI) calculates metrics for the S&P 500.
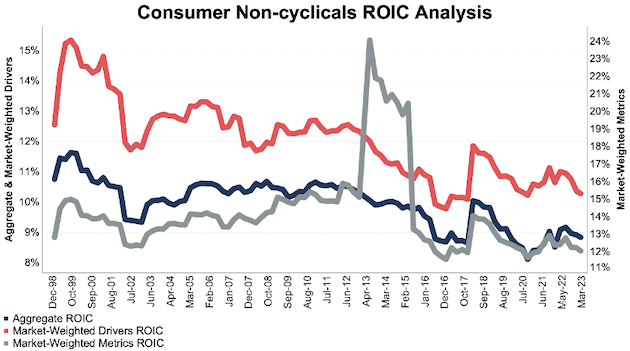
For additional perspective, we compare the Aggregate method for ROIC with two other market-weighted methodologies: market-weighted metrics and market-weighted drivers. Each method has its pros and cons, which are detailed in the Appendix.
Figure 3 compares these three methods for calculating the Consumer Non-cyclicals sector’s ROICs.
Figure 32: Consumer Non-cyclicals ROIC Methodologies Compared: Dec 1998 – 3/8/23
Sources: New Constructs, LLC and company filings.
The March 8, 2023 measurement period uses price data as of that date for our WACC calculation and incorporates the financial data from 2022 10-Ks for ROIC, as this is the earliest date for which all of the 2022 10-Ks for the NC 2000 constituents were available.
This article was originally published on March 31, 2023.
Disclosure: David Trainer, Kyle Guske II, and Italo Mendonça receive no compensation to write about any specific stock, style, or theme.
Follow us on Twitter, Facebook, LinkedIn, and StockTwits for real-time alerts on all our research.
Appendix: Analyzing ROIC with Different Weighting Methodologies
We derive the metrics above by summing the individual NC 2000/sector constituent values for revenue, NOPAT, and invested capital to calculate the metrics presented. We call this approach the “Aggregate” methodology.
The Aggregate methodology provides a straightforward look at the entire sector, regardless of market cap or index weighting and matches how S&P Global (SPGI) calculates metrics for the S&P 500.
For additional perspective, we compare the Aggregate method for ROIC with two other market-weighted methodologies:
- Market-weighted metrics – calculated by market-cap-weighting the ROIC for the individual companies relative to their sector or the overall NC 2000 in each period. Details:
- Company weight equals the company’s market cap divided by the market cap of the NC 2000/its sector
- We multiply each company’s ROIC by its weight
- NC 2000/Sector ROIC equals the sum of the weighted ROICs for all the companies in the NC 2000/each sector
- Market-weighted drivers – calculated by market-cap-weighting the NOPAT and invested capital for the individual companies in the NC 2000/each sector in each period. Details:
- Company weight equals the company’s market cap divided by the market cap of the NC2000/its sector
- We multiply each company’s NOPAT and invested capital by its weight
- We sum the weighted NOPAT and invested capital for each company in the NC 2000/each sector to determine the NC 2000/sector’s weighted NOPAT and weighted invested capital
- NC 2000/Sector ROIC equals weighted NC 2000/sector NOPAT divided by weighted NC 2000/sector invested capital
Each methodology has its pros and cons, as outlined below:
Aggregate method
Pros:
- A straightforward look at the entire NC 2000/sector, regardless of company size or weighting.
- Matches how S&P Global calculates metrics for the S&P 500.
Cons:
- Vulnerable to impact of by companies entering/exiting the group of companies, which could unduly affect aggregate values despite the level of change from companies that remain in the group.
Market-weighted metrics method
Pros:
- Accounts for a firm’s size relative to the overall NC 2000/sector and weights its metrics accordingly.
Cons:
- Vulnerable to outsized impact of one or a few companies. This outsized impact tends to occur only for ratios where unusually small denominator values can create extremely high or low results.
Market-weighted drivers method
Pros:
- Accounts for a firm’s size relative to the overall NC 2000/sector and weights its NOPAT and invested capital accordingly.
- Mitigates potential outsized impact of one or a few companies by aggregating values that drive the ratio before calculating the ratio.
Cons:
- Can minimize the impact of period-over-period changes in smaller companies, as their impact on the overall sector NOPAT and invested capital is smaller.
[1] Calculated using SPGI’s methodology, which sums up individual NC 2000 constituent values for NOPAT and invested capital. See Appendix III for more details on this “Aggregate” method and Appendix I for details on how we calculate WACC for the NC 2000 and each of its sectors.
[2] This report is based on the latest audited financial data available, which is the 2022 10-K in most cases. Price data as of 3/8/23.
[3] Our research utilizes our Core Earnings, a more reliable measure of profits, as proven in Core Earnings: New Data & Evidence, written by professors at Harvard Business School (HBS) & MIT Sloan and published in The Journal of Financial Economics.
[4] The full version of this report provides the same analysis for all eleven sectors.