This month, we’re featuring a stock that has been in the Dividend Growth Stocks Model Portfolio for multiple months. The featured stock summary below is an example of the research we do. It is not a full Long Idea report, but we do think it is important that you’re able to see our research on stocks on a regular basis.
Our process for picking stocks is about as rigorous as it gets, and we’re proud to show our work. We’re not giving you the ticker below, because that is only available to our Pro and Institutional members. But, there’s still so much here to show you how much work we do so you know where to set the bar when evaluating research providers.
We hope you enjoy this research. Feel free to share with friends and colleagues.
As David shared in a recent training, dividends provide a safe haven in a volatile market, and the stocks in this Model Portfolio have great potential for dividend growth in the future.
We update this Model Portfolio monthly, August’s Dividend Growth Model Portfolio, was updated and published for clients on August 29, 2024.
Recap from July’s Picks
The best performing stock was up 46%. Overall, 9 out of the 29 Dividend Growth Stocks outperformed their benchmark (S&P 500) from July 30, 2024 through August 27, 2024.
This report leverages our cutting-edge Robo-Analyst technology to deliver proven-superior fundamental research and support more cost-effective fulfillment of the fiduciary duty of care.
This Model Portfolio mimics an “All Cap Blend” style with a focus on dividend growth. Selected stocks earn an Attractive or Very Attractive rating, generate positive free cash flow (FCF) and economic earnings, offer a current dividend yield >1%, and have a 5+ year track record of consecutive dividend growth. This Model Portfolio is designed for investors who favor long-term capital appreciation over current income, but still appreciate the power of growing dividends.
Featured Stock for August: Basic Materials Company
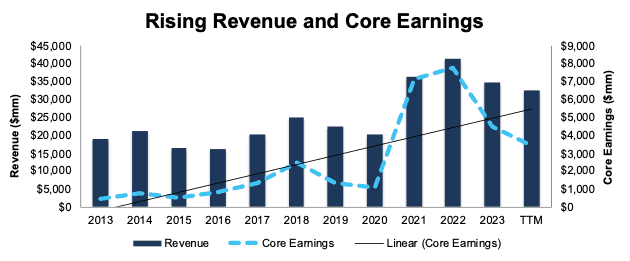
This company has grown revenue and Core Earnings by 5% and 20% compounded annually, respectively, over the past decade. The company’s NOPAT margin increased from 4% in 2013 to 11% in the TTM, while invested capital turns fell from 1.5 to 1.3 over the same time. Rising NOPAT margins are enough to offset falling invested capital turns and drive return on invested capital (ROIC) from 5% in 2013 to 14% in the TTM.
Figure 1: Revenue & Core Earnings Since 2013
Sources: New Constructs, LLC and company filings
Free Cash Flow Supports Regular Dividend Payments
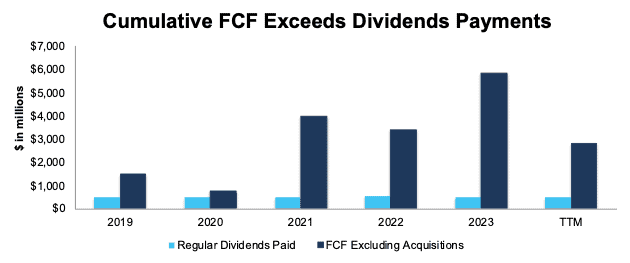
This company has increased its regular, quarterly dividend from $0.40/share in 2Q19 to $0.54/share in 2Q24. The quarterly dividend, when annualized, equals $2.16/share and provides a 1.5% dividend yield.
More importantly, the company’s cumulative free cash flow (FCF) easily exceeds its dividend payments. From 2019 through 2Q24, the company generated $15.8 billion (43% of current enterprise value) in FCF while paying $2.8 billion in dividends. See Figure 2.
Figure 2: FCF vs. Dividends Since 2019
Sources: New Constructs, LLC and company filings
Companies with FCF well above dividend payments provide higher-quality dividend growth opportunities. On the other hand, dividends that exceed FCF cannot be trusted to grow or even be maintained.
This Stock Is Undervalued
At its current price, this stock has a price-to-economic book value (PEBV) ratio of 0.9. This ratio means the market expects the company’s NOPAT to permanently fall 10% from current levels. This expectation seems overly pessimistic given that the company has grown NOPAT by 6% and 17% over the past five and ten years, respectively.
….there’s much more in the full report. You can start your membership here to get access to this report and much more.


