Neutral Rating for Financial Sector Means ETF Investors Should Beware
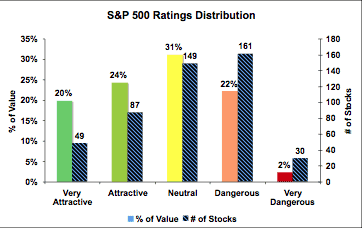
Investors in Financial Sector ETFs needs to be very careful about which ETF they buy because there are simply not that many good stocks as compared to bad stocks in the sector. The Financial sector is one of 5 that gets our Neutral rating.