

As we continue our quarterly ETF and mutual fund sector and style research, we’ve identified a mutual fund that, despite strong recent performance, fails to invest in stocks with Attractive risk/reward.
Every investor has seen some version of the disclaimer “past performance is not an indicator of future performance”, yet, past performance drives nearly all fund ratings – except ours.
We think the quality of the fund’s holdings matters more than past performance. That’s why our Predictive Fund Ratings are built on the ratings of the fund’s holdings. If the fund hold bad stocks, performance is likely to be bad too. And, vice versa.
This week’s Danger Zone pick is a fund that allocates way too much capital to companies with low profitability and expensive valuations, details below. Tarkio Fund (TARKX) is this week’s Danger Zone pick.
Forward-Looking Research Protects Investors
While legacy fund research is backward-looking, our fund research is forward-looking and based on proven-superior fundamental analysis and ratings on each individual holding.
TARKX earns our Very Unattractive (equivalent to Morningstar’s 1 Star) rating while Morningstar (MORN) gives the fund a 3 Star rating. Figure 1 shows how our forward-looking Fund Ratings compare to Morningstar’s ratings.
Figure 1: Tarkio Fund Ratings

Sources: New Constructs, LLC, company filings, mutual fund filings, and Morningstar
Fund Methodology Short on Quantifiable Details
Per the fund’s prospectus, Tarkio Fund’s guiding principle is that “a long-term investor in common stock is a partner with the business in which it invests.” The fund’s adviser employs a “bottom up, fundamental approach to identify equity investments that satisfy its quality and valuation standards.”
The advisor defines quality companies as those “run by a management team focused on creating long-term value in the business.” The advisor’s qualitative review of a company looks at:
- organizational culture,
- corporate integrity,
- capital allocation, and
- long-term focus of management.
The “metrics” used to measure these characteristics are largely qualitative, as the fund’s prospectus notes the advisor looks for companies that demonstrate:
- high-levels of integrity,
- humility,
- trust,
- long-term focus,
- purpose and passion,
- teamwork, and
- a focus on employee empowerment.
The adviser also analyzes a company’s performance in regard to environmental, social, and governance (ESG) factors using its own internal process.
From a qualitative perspective, the traits used to pick stocks for this fund sound great.
However, without clearly identifiable quantitative metrics, we can only judge the advisers based on what we can actually measure: the profitability and valuation of the stocks held in the fund.
When we do so, we find that TARKX’s adviser isn’t identifying companies with strong risk/reward, but rather highly overvalued stocks, as we’ll show.
Holdings Research Reveals a Low-Quality Mid Cap Blend Portfolio
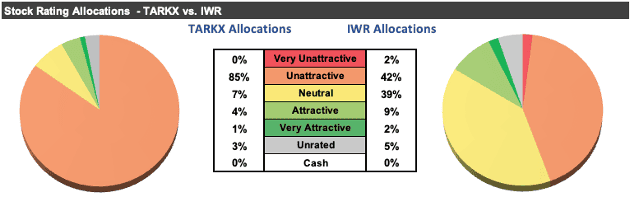
Our Robo-Analyst AI[1] analyzed the holdings of this fund and finds that they are much worse than its lower-cost benchmark, iShares Russell Mid-Cap ETF (IWR), which earns a Neutral rating.
Per Figure 2, TARKX allocates 85% of its assets to Unattractive-or-worse rated stocks compared to 44% for IWR. On the flip side, TARKX allocates only 5% of its assets to Attractive-or-better rated stocks compared to 11% for IWR.
Figure 2: Tarkio Fund Allocates to Far Worse Stocks than IWR
Sources: New Constructs, LLC, company, ETF, and mutual fund filings
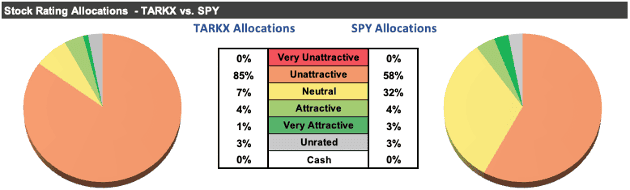
Per Figure 3, our holdings analysis also reveals TARKX’s portfolio is lower quality than the S&P 500, which the fund compares its returns to. The S&P 500 is represented by State Street SPDR S&P 500 ETF (SPY), which earns an Attractive rating.
At 58% of its portfolio, SPY allocates less to Unattractive-or-worse rated stocks compared to TARKX (at 85%). SPY also allocates slightly more to Attractive-or-better rated stocks (7%) compared to TARKX (5%).
Figure 3: Tarkio Fund Allocates to Worse Stocks than SPY
Sources: New Constructs, LLC, company, ETF, and mutual fund filings
Given TARKX allocates just 5% of assets to Attractive-or-better rated stocks, it appears poorly positioned to continue to generate the outperformance required to justify active management fees.
Expensive Stocks Drive Very Unattractive Risk/Reward Rating
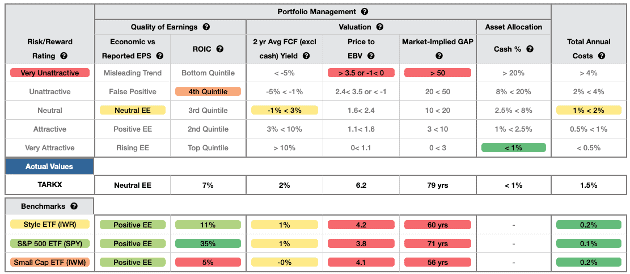
Figure 4 shows our detailed rating for TARKX, which includes each of the criteria we use to rate all ETFs and mutual funds under coverage. These criteria are the same for our Stock Rating Methodology, as the performance of a mutual fund equals the performance of its holdings minus fees. Figure 4 also compares TARKX’s rating with those of IWR and SPY.
Figure 4: Tarkio Fund Rating Details
Sources: New Constructs, LLC, company, ETF, and mutual fund filings
TARKX’s holdings are inferior to IWR and SPY in four of the five criteria that make up our Portfolio Management rating. Specifically:
- TARKX’s holdings earn a Neutral Economic vs. Reported EPS rating, compared to Attractive for IWR and SPY.
- TARKX’s ROIC is 6%, which is lower than IWR’s (12%) and SPY’s (35%).
- The price-to-economic book value (PEBV) ratio for TARKX holdings is 6.2, which is much worse (higher) than the 4.2 for IWR and 3.8 for SPY.
- Our discounted cash flow (DCF) analysis reveals an average market-implied growth appreciation period (GAP) of 79 years for TARKX’s holdings compared to 60 years and 71 years for IWR’s and the S&P 500’s holdings, respectively.
In other words, market expectations for stocks held by TARKX imply profits will grow substantially more than the stock’s held by IWR and SPY (measured by PEBV ratio and GAP), despite TARKX’s holdings being less profitable (as measured by ROIC and economic earnings).
This rigorous holdings analysis reveals that TARKX provides exposure to less profitable companies, while taking much more valuation risk than the benchmark and S&P 500.
Fees Make Owning TARKX Worse
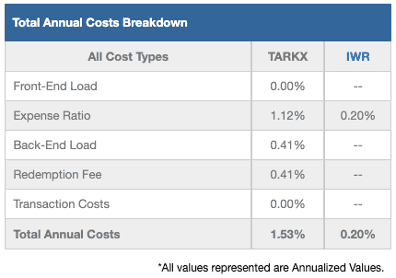
At 1.53%, TARKX’s total annual costs (TAC) may seem more reasonable than some of the highest cost funds in the Mid Cap Blend style. But any fees for Very Unattractive holdings is money poorly spent.
For reference, the asset-weight average TAC of all the Mid Cap Blend mutual funds under coverage is 0.59% and the simple-weighted average is 2.04%. IWR charges just 0.20% and SPY has total annual costs of just 0.10%. Why pay higher fees for inferior stock selection?
Our TAC metric accounts for more than just the expense ratio. We consider the impact of front-end loads, back-end loads, redemption fees, and transaction costs.
Figure 5 shows our breakdown of TARKX’s total annual costs, which we provide for all ~6,100+ mutual funds and ~1,000+ ETFs under coverage.
Figure 5: Tarkio Fund’s Total Annual Costs Breakdown
Sources: New Constructs, LLC, company, ETF, and mutual fund filings
To justify charging higher fees, TARKX must outperform its benchmark by 133 basis points annually over three years.
In recent years, TARKX’s average annual returns have outperformed the Mid Cap benchmark. However, continued outperformance is no guarantee. In fact, according to S&P Dow Jones U.S. Persistence Scorecard, on average only 8% of active equity funds that beat their benchmark in 2022 outperformed over the next two years. For Mid Cap funds, the percent of funds that outperformed over the next two years falls to 5.9%.
Longer-term, ~90% of active equity fund managers underperformed their benchmarks over the 10-year period ending December 31, 2024, according to S&P Dow Jones Indices’ SPIVA Institutional Scorecard.
In other words, it’s very difficult to beat the market over the long-term, and TARKX’s recent outperformance is no guarantee of future outperformance.
Given that 85% of its assets are allocated to stocks with Unattractive-or-worse ratings, and 92% are allocated to stocks with Neutral-or-worse ratings, TARKX looks more likely to underperform moving forward.
Get an Edge from Holdings-Based Fund Analysis Based on Superior Stock Research
We offer clients in-depth reports for all ~7,100+ ETFs and mutual funds under coverage. Click below for a free copy of our TARKX standard mutual fund report.
Smart fund (or ETF) investing means analyzing each of the holdings of a fund. Failure to do so is a failure to perform proper due diligence. Simply buying an ETF or mutual fund based on past performance does not necessarily lead to outperformance. Only thorough holdings-based research can help determine if a fund’s methodology leads managers to pick high-quality or low-quality stocks.
Our Robo-Analyst technology analyzes the holdings of all 454 ETFs and mutual funds in the Mid Cap Blend style and 7,100+ ETFs and mutual funds under coverage to avoid “the danger within”.
Easily Make Any Fund, Even TARKX, Better
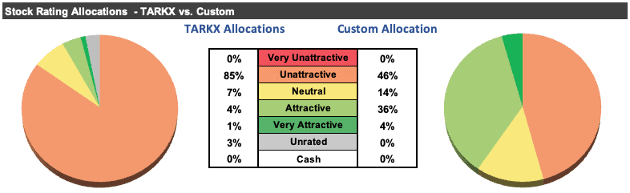
As we show in The Paradigm Shift to DIY ETFs, new technologies enable investors to create their own fund without any fees while also enabling better, more sophisticated weighting methodologies. For example, if we reallocate the fund’s capital to the companies with the best free cash flow (FCF), our customized fund allocates more capital to better stocks:
- 41% of assets to Attractive-or-better rated stocks (compared to 5% for TARKX)
- 46% of assets to Unattractive-or-worse rated stocks (compared to 85% for TARKX)
Compare the quality of stock allocation in as-is TARKX vs. our customed version of TARKX in Figure 6. While we can’t fix the bad stock picks, we can, at least, be sure to allocate more capital to the better stocks.
Figure 6: Tarkio Fund Allocation Could Be Improved
Sources: New Constructs, LLC, company, and mutual fund filings
Note that our DIY ETF tool allows clients to pick and weight portfolio holdings based on multiple proprietary metrics, such as Core Earnings, Economic Earnings, ROIC, Net Operating Profit After Tax and more.
Check Out the Indices Based on New Constructs Research
While we’re writing about indices and ETFs, we want to highlight the indices we’ve developed with Bloomberg’s Index Licensing Group. All three outperformed the S&P 500 over the past five years. See Figures 7-9.
- Bloomberg New Constructs Core Earnings Leaders Index (ticker: BCORET:IND)
- Bloomberg New Constructs Ratings VA-1 Index (ticker: BNCVA1T:IND)
- Bloomberg New Constructs 500 Index (ticker: B500NCT:IND)
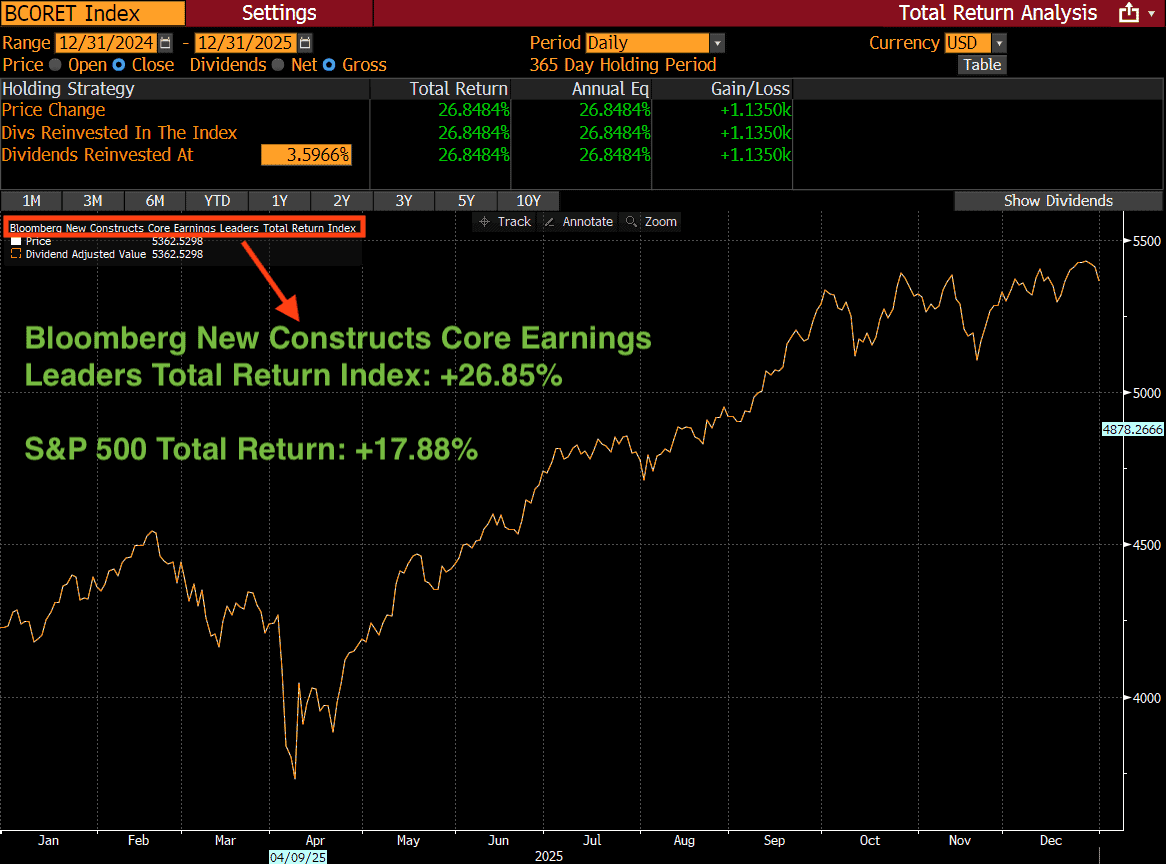
The Bloomberg New Constructs Core Earnings Leaders Index, which allocates based on Earnings Capture and Core Earnings, beat the S&P 500 by 9% in 2025. The Index (ticker: BCORET:IND) was up 27% while the S&P 500 was up 18%.
Figure 7: Bloomberg New Constructs Core Earnings Leaders Index Outperforms S&P 500 in 2025
Sources: Bloomberg as of December 31, 2025
Note: Past performance is no guarantee of future results.
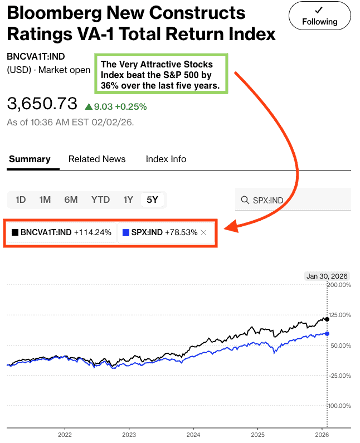
The “Very Attractive Stocks” Index, which allocates to stocks that get a Very Attractive rating by our AI Agent for Investing, beat the S&P 500 by 36% over the last five years. Bloomberg’s official name for the index is Bloomberg New Constructs Ratings VA-1Index (ticker: BNCVAT1T:IND). Figure 8 shows it was up 114% while the S&P 500 was up 79%.
Figure 8: Very Attractive-Rated Stocks Strongly Outperform the S&P 500: Last Five Years
Sources: Bloomberg as of January 30, 2026
Note: Past performance is no guarantee of future results.
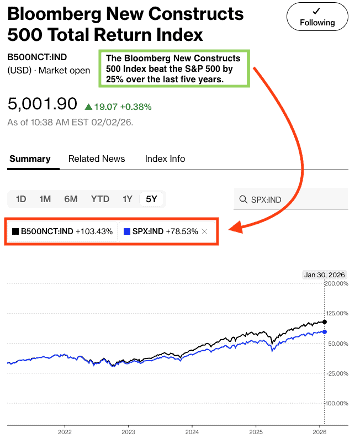
Our “Core-Earnings Weighted S&P 500” Index, which weights the largest 500 U.S. companies by Core Earnings instead of market cap, beat the S&P 500 by 25% over the past five years. Bloomberg’s official name for the index is Bloomberg New Constructs 500 Total Return Index (ticker: B500NCT:IND). Figure 9 shows it was up 103% while the S&P 500 was up 79%.
Figure 9: Bloomberg New Constructs 500 Index Strongly Outperforms the S&P 500: Last Five Years
Sources: Bloomberg as of January 30, 2026
Note: Past performance is no guarantee of future results.
Better Options for Mid Cap Blend Funds
Below we present three Mid Cap Blend ETFs or mutual funds that feature a Very Attractive rating, >$100 million in assets under management, and below simple-average TAC:
- Vanguard U.S. Multifactor Fund (VFMFX) – 0.20% TAC
- First Trust Active Factor Mid Cap ETF (AFMC) – 0.72% TAC
- LeaderShares AlphaFactor U.S. Core Equity ETF – 0.83% TAC
This article was originally published on February 2, 2026.
Disclosure: David Trainer and Kyle Guske II receive no compensation to write about any specific stock, sector, style, or theme.
Questions on this report or others? Join our online community and connect with us directly.
[1] See Harvard Business School case study: New Constructs: Disrupting Fundamental Analysis with Robo-Analysts.