
Sector Analysis 2Q16
The Consumer Discretionary sector ranks fifth out of the ten sectors as detailed in our 2Q16 Sector Ratings for ETFs and Mutual Funds report. Last quarter, the Consumer Discretionary sector ranked fifth as well. It gets our Neutral rating, which is based on aggregation of ratings of 13 ETFs and 19 mutual funds in the Consumer Discretionary sector as of April 15, 2016. See a recap of our 1Q16 Sector Ratings here. Figures 1 and 2 show the five best and worst rated ETFs and mutual funds in the sector. Not all Consumer Discretionary sector ETFs and mutual funds are created the same. The number of holdings varies widely (from 25 to 389). This variation creates drastically different investment implications and, therefore, ratings.
Investors seeking exposure to the Consumer Discretionary sector should buy one of the Attractive-or-better rated ETFs or mutual funds from Figures 1 and 2.
Figure 1: ETFs with the Best & Worst Ratings – Top 5

* Best ETFs exclude ETFs with TNAs less than $100 million for inadequate liquidity.
Sources: New Constructs, LLC and company filings
PowerShares Dynamic Retail Portfolio (PMR), PowerShares S&P SmallCap Consumer Discretionary Portfolio (PSCD), and Guggenheim S&P 500 Equal Weight Consumer Discretionary ETF (RCD) are excluded from Figure 1 because their total net assets (TNA) are below $100 million and do not meet our liquidity minimums.
Figure 2: Mutual Funds with the Best & Worst Ratings – Top 5

* Best mutual funds exclude funds with TNAs less than $100 million for inadequate liquidity.
Sources: New Constructs, LLC and company filings
ICON Consumer Discretionary Fund (ICCCX), Rydex Series Leisure Fund (RYLIX, RYLAX) are excluded from Figure 2 because their total net assets (TNA) are below $100 million and do not meet our liquidity minimums.
PowerShares Dynamic Leisure & Entertainment Portfolio (PEJ) is the top-rated Consumer Discretionary ETF and Fidelity Select Leisure Portfolio (FDLSX) is the top-rated Consumer Discretionary mutual fund. PEJ earns a Very Attractive rating and FDLSX earns an Attractive rating.
SPDR S&P Retail ETF (XRT) is the worst rated Consumer Discretionary ETF and Rydex Series Retailing Fund (RYRTX) is the worst-rated Consumer Discretionary mutual fund. XRT earns a Neutral rating and RYRTX earns a Very Dangerous rating.
451 stocks of the 3000+ we cover are classified as Consumer Discretionary stocks.
Carnival Corporation (CCL: $52/share) is one of our favorite stocks held by PEJ and earns an Attractive rating. Since 1998, Carnival has grown after-tax profit (NOPAT) by 6% compounded annually. The company currently earns a 7% return on invested capital (ROIC), which is improved from the 4% earned in 2013. Over the past five years, Carnival has generated a cumulative $8 billion in free cash flow (FCF). Best of all, CCL is currently undervalued. At its current price of $52/share, CCL has a price-to-economic book value (PEBV) ratio of 1.0. This ratio means that the market expects Carnival’s NOPAT to never meaningfully grow from current levels. If Carnival can grow NOPAT by just 4% compounded annually for the next decade, the stock is worth $68/share today – a 31% upside.
Amazon.com (AMZN: $621/share) remains one of our least favorite stocks held by RYRTX and earns a Dangerous rating. Over the past decade, Amazon’s economic earnings have declined from $242 million to -$508 million. The company’s ROIC has declined from 27% in 2005 to 6% in 2015, which represents a clear sign that Amazon’s low margin, grow at all costs business strategy has been an inefficient use of capital. Worst of all, the expectations baked in AMZN already imply the company will be wildly profitable. To justify the current stock price of $621/share, AMZN must grow NOPAT by 22% compounded annually for the next 20 years. In this scenario, 20 years from now, Amazon would be generating over $8 trillion in revenue. Such expectations seem irrationally exuberant and make AMZN one to avoid.
Figures 3 and 4 show the rating landscape of all Consumer Discretionary ETFs and mutual funds.
Figure 3: Separating the Best ETFs From the Worst ETFs
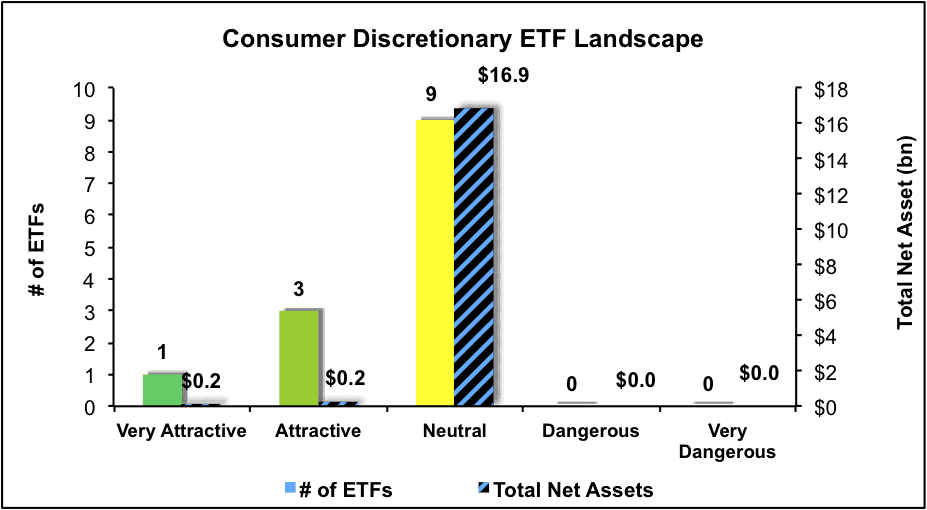
Sources: New Constructs, LLC and company filings
Figure 4: Separating the Best Mutual Funds From the Worst Mutual Funds
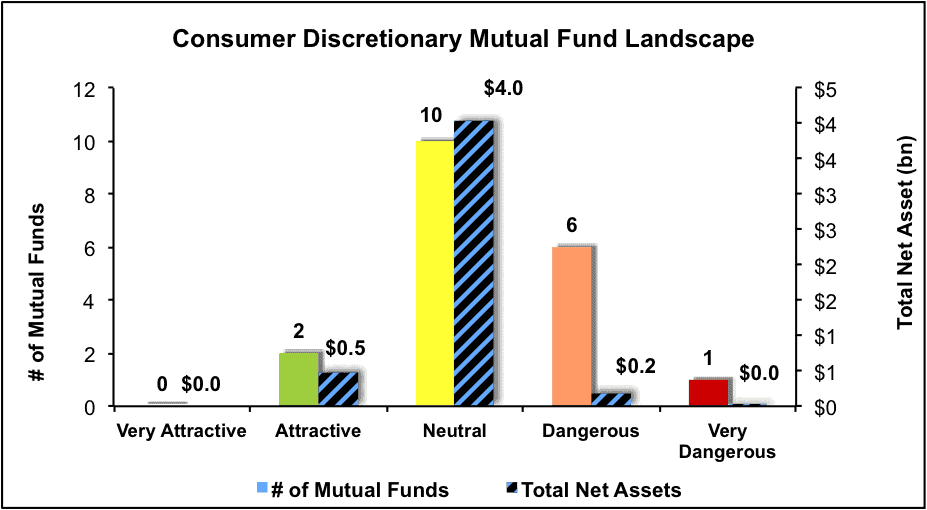
Sources: New Constructs, LLC and company filings
Disclosure: David Trainer and Kyle Guske II receive no compensation to write about any specific stock, sector or theme.
Click here to download a PDF of this report.
Photo Credit: feng tian (Flickr)