The All-cap Blend style ranks third out of the twelve fund styles as detailed in my Style Rankings for ETFs and Mutual Funds report. It gets my Neutral rating, which is based on aggregation of ratings of 35 ETFs and 708 mutual funds in the All-cap Blend style as of May 1, 2013. Prior reports on the best & worst ETFs and mutual funds in every sector and style are here.
Figures 1 and 2 show the five best and worst ETFs and mutual funds in the All-cap Blend style. Not all All-cap Blend style ETFs and mutual funds are created the same. The number of holdings varies widely (from 6 to 3,269), which creates drastically different investment implications and ratings. The best ETFs and mutual funds allocate more value to Attractive-or-better-rated stocks than the worst, which allocate too much value to Neutral-or-worse-rated stocks.
To identify the best and avoid the worst ETFs and mutual funds within the All-cap Blend style, investors need a predictive rating based on (1) stocks ratings of the holdings and (2) the all-in expenses of each ETF and mutual fund. Investors need not rely on backward-looking ratings.
My fund rating methodology is detailed here.
Investors seeking exposure to the All-cap Blend style should buy one of the Attractive-or-better rated ETFs or mutual funds from Figures 1 and 2.
Get my ratings on all ETFs and mutual funds in this style on my free mutual fund and ETF screener.
Figure 1: ETFs with the Best & Worst Ratings – Top 5
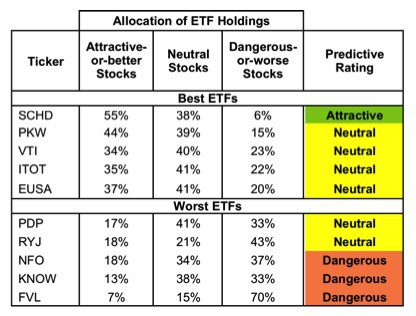 * Best ETFs exclude ETFs with TNAs less than $100 million for inadequate liquidity.
Sources: New Constructs, LLC and company filings
Three ETFs are excluded from Figure 1 because their total net assets (TNA) are below $100 million and do not meet our liquidity standards.
Figure 2: Mutual Funds with the Best & Worst Ratings – Top 5
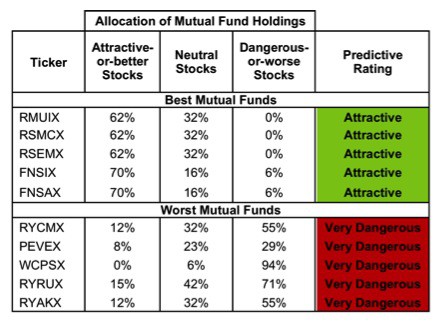 * Best mutual funds exclude funds with TNAs less than $100 million for inadequate liquidity.
Sources: New Constructs, LLC and company filings
Three mutual funds are excluded from Figure 2 because their total net assets (TNA) are below $100 million and do not meet our liquidity standards.
Schwab US Dividend Equity ETF (SCHW) is my top-rated All-cap Blend ETF and Royce Special Equity Multi-cap Fund (RMUIX) is my top-rated All-cap Blend mutual fund. Both earn my Attractive rating.
First Trust Value Line 100 ETF (FVL) is my worst-rated All-cap Blend ETF and Rydex Series Funds: Russell 2000 1.5x Strategy Fund (RYAKX) is my worst-rated All-cap Blend mutual fund. FVL earns my Dangerous rating and RYAKX earns my Very Dangerous rating.
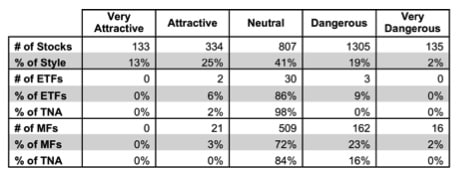
Figure 3 shows that 466 out of the 2,714 stocks (over 38% of the market value) in All-cap Blend ETFs and mutual funds get an Attractive-or-better rating. However, only 2 out of 35 All-cap Blend ETFs (less than 3% of total net assets) and 21 out of 708 All-cap Blend mutual funds (less than 1% of total net assets) get an Attractive-or-better rating.
This analysis shows that mutual fund managers and ETF providers do a poor job of allocating to the best stocks in the style, which means they do not deserve their fees.
Figure 3: All-cap Blend Style Landscape For ETFs, Mutual Funds & Stocks
 Sources: New Constructs, LLC and company filings
As detailed in “Cheap Funds Dupe Investors”, the fund industry offers many cheap funds but very few funds with high-quality stocks, or with what I call good portfolio management.
Investors need to tread carefully when considering All-cap Blend ETFs and mutual funds, as 3 ETFs and 178 mutual funds in the All-cap Blend style earn a Dangerous-or-worse rating. Only 2 ETFs and 21 mutual funds in the All-cap Blend style allocate enough value to Attractive-or-better-rated stocks to earn an Attractive rating.
Analog Devices, Inc. (ADI) is one of my favorite stocks held by All-cap Blend ETFs and mutual funds and earns my Very Attractive rating. ADI has a consistently high return on invested capital (ROIC). Its current ROIC of 47.5% puts it in the top 20 of all companies in the S&P 500. Its $3.8 billion in excess cash is more than double the amount of its combined debt, pension, and employee stock option liabilities. This healthy amount of cash on hand, as well as a consistently positive free cash flow, is encouraging given ADI’s demonstrated ability to turn growth in invested capital into profit growth. Despite these solid fundamentals, ADI has very conservative expectations embedded in its current valuation of ~$43.99/share. At this share price, ADI has a price to economic book value of only 1.1, implying the company’s NOPAT will never be more than 10% greater than its 2012 level. Strong fundamentals combined with a low valuation make ADI a low risk/high reward prospect for investors.
LKQ Corporation (LKQ) is one of my least favorite stocks held by All-cap Blend ETFs and mutual funds and earns my Very Dangerous rating. Investors valuing LKQ based on its accounting earnings should think twice because that value is a poor indicator of the true profit the company is creating for investors. LKQ’s economic earnings per share (only $0.10 versus GAAP EPS of $0.87 for 2012) give a much more accurate picture of the relatively small amount of value the company is creating for investors. Companies whose GAAP earnings per share are significantly higher than economic earnings per share tend to be be overvalued as LKQ is. To justify its current valuation of ~$24.08/share, LKQ must grow NOPAT by 13% compounded annually for 17 years. Such a high valuation leaves little room for further upside in this stock. Investors should look elsewhere.
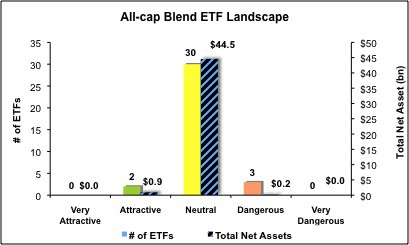
Figures 4 and 5 show the rating landscape of all All-cap Blend ETFs and mutual funds.
My Style Rankings for ETFs and Mutual Funds report ranks all styles and highlights those that offer the best investments.
Figure 4: Separating the Best ETFs From the Worst Funds
 Sources: New Constructs, LLC and company filings
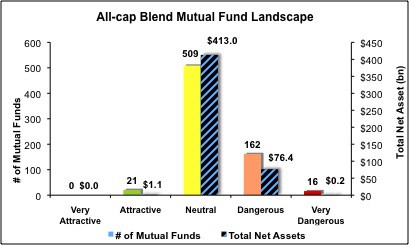
Figure 5: Separating the Best Mutual Funds From the Worst Funds
 Sources: New Constructs, LLC and company filings
Review my full list of ratings and rankings along with reports on all 35 ETFs and 708 mutual funds in the All-cap Blend style.
Sam McBride contributed to this report.
Disclosure: David Trainer owns ADI. David Trainer and Sam McBride receive no compensation to write about any specific stock, sector, style or theme.