
Sector Analysis 2Q16
The Financials sector ranks sixth out of the ten sectors as detailed in our 2Q16 Sector Ratings for ETFs and Mutual Funds report. Last quarter, the Financials sector ranked seventh. It gets our Neutral rating, which is based on aggregation of ratings of 38 ETFs and 249 mutual funds in the Financials sector as of April 15, 2016. See a recap of our 1Q16 Sector Ratings here.
Figures 1 and 2 show the five best and worst rated ETFs and mutual funds in the sector. Not all Financials sector ETFs and mutual funds are created the same. The number of holdings varies widely (from 21 to 572). This variation creates drastically different investment implications and, therefore, ratings.
Investors seeking exposure to the Financials sector should buy one of the Attractive-or-better rated ETFs or mutual funds from Figures 1 and 2.
Figure 1: ETFs with the Best & Worst Ratings – Top 5
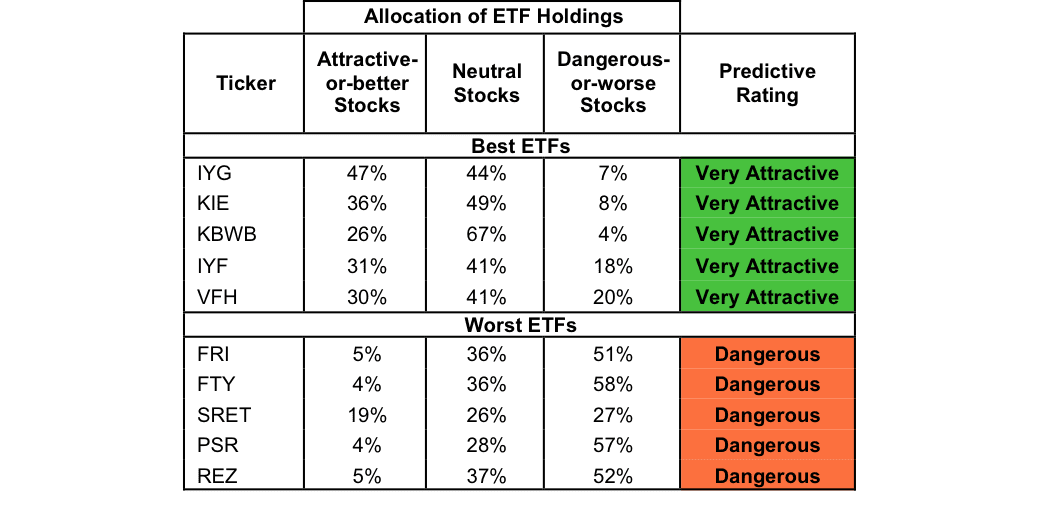
* Best ETFs exclude ETFs with TNAs less than $100 million for inadequate liquidity.
Sources: New Constructs, LLC and company filings
PowerShares KBW Property & Casualty Insurance Portfolio (KBWP) is excluded from Figure 1 because its total net assets (TNA) are below $100 million and do not meet our liquidity minimums.
Figure 2: Mutual Funds with the Best & Worst Ratings – Top 5

* Best mutual funds exclude funds with TNAs less than $100 million for inadequate liquidity.
Sources: New Constructs, LLC and company filings
Schwab Financial Services Fund (SWFFX) is excluded from Figure 2 because its total net assets (TNA) are below $100 million and do not meet our liquidity minimums.
iShares U.S. Financials Services ETF (IYG) is the top-rated Financials ETF and Fidelity Select Banking Portfolio (FSRBX) is the top-rated Financials mutual fund. Both earn a Very Attractive rating.
iShares Residential Real Estate Capped ETF (REZ) is the worst rated Financials ETF and Rydex Series Real Estate Fund (RYREX) is the worst rated Financials mutual fund. REZ earns a Dangerous rating and RYREX earns a Very Dangerous rating.
595 stocks of the 3000+ we cover are classified as Financials stocks.
American Express (AXP: $62/share) is one of our favorite stocks held by IYG and earns a Very Attractive rating. We previously published a case study outlining how AXP could boost its value by $50 billion by making strategic decisions to boost return on invested capital (ROIC). Over the past six years, American Express has grown after-tax profit (NOPAT) by 6% compounded annually. At the same time, the company has improved its ROIC from 12% in 2005 to a top-quintile 20% in 2015. However, some short-term issues, which we identify in our case study have left AXP undervalued. At its current price of $62/share, American Express has a price-to-economic book value (PEBV) ratio of 0.9. This ratio means that the market expects American Express’ NOPAT to permanently decline by 10%. If AXP can, instead, grow NOPAT by 6% compounded annually for the next decade, the stock is worth $98/share today – a 58% upside.
Essex Property Trust (ESS: $225/share) is one of our least favorite stocks held by REZ and earns a Very Dangerous rating. Essex earns its rating in large part to its misleading earnings. Over the past decade, GAAP net income has grown by 11% compounded annually. However, Essex’s economic earnings, its true cash flows, have declined from $7 million to -$249 million over the same time period. Further highlighting the deterioration of Essex’s operations, the company’s ROIC has halved from 8% in 2005 to a bottom-quintile 4% in 2015. GAAP earnings have propped up shares for too long, and ESS remains overvalued. In order to justify its current price of $225/share, Essex must grow NOPAT by 12% compounded annually for the next 11 years. After a decade of shareholder value destruction, the expectations baked in ESS remain too high.
Figures 3 and 4 show the rating landscape of all Financials ETFs and mutual funds.
Figure 3: Separating the Best ETFs From the Worst ETFs
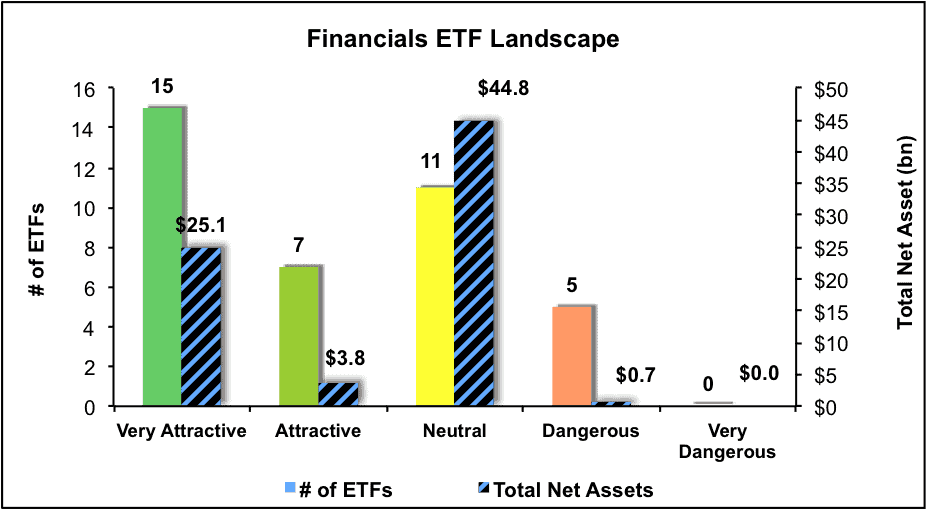
Sources: New Constructs, LLC and company filings
Figure 4: Separating the Best Mutual Funds From the Worst Mutual Funds
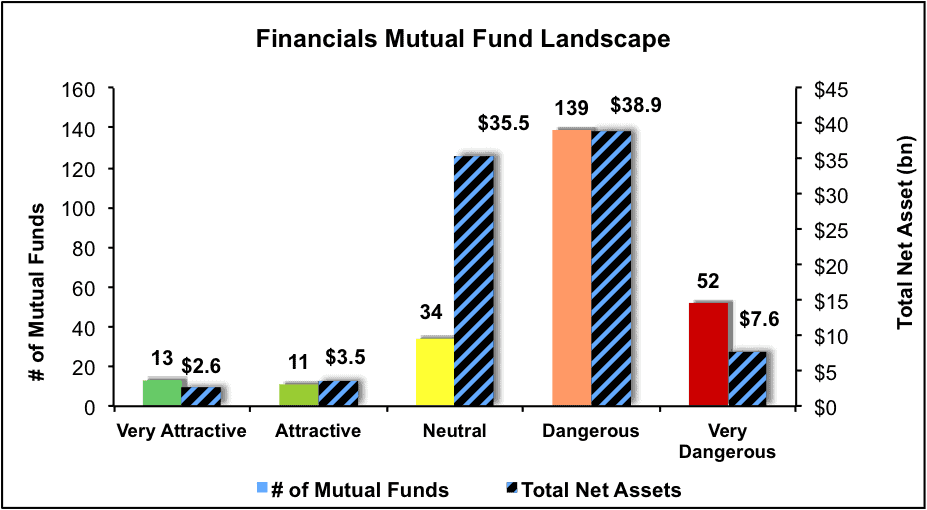
Sources: New Constructs, LLC and company filings
Disclosure: David Trainer and Kyle Guske II receive no compensation to write about any specific stock, sector or theme.
Click here to download a PDF of this report.
Photo Credit: davidcuen (Flickr)