
Sector Analysis 2Q16
The Information Technology sector ranks fourth out of the ten sectors as detailed in our 2Q16 Sector Ratings for ETFs and Mutual Funds report. Last quarter, the Information Technology sector ranked third. It gets our Neutral rating, which is based on aggregation of ratings of 29 ETFs and 122 mutual funds in the Information Technology sector as of April 18, 2016. See a recap of our 1Q16 Sector Ratings here.
Figures 1 and 2 show the five best and worst rated ETFs and mutual funds in the sector. Not all Information Technology sector ETFs and mutual funds are created the same. The number of holdings varies widely (from 25 to 384). This variation creates drastically different investment implications and, therefore, ratings.
Investors seeking exposure to the Information Technology sector should buy one of the Attractive-or-better rated ETFs or mutual funds from Figures 1 and 2.
Figure 1: ETFs with the Best & Worst Ratings – Top 5

* Best ETFs exclude ETFs with TNAs less than $100 million for inadequate liquidity.
Sources: New Constructs, LLC and company filings
Figure 2: Mutual Funds with the Best & Worst Ratings – Top 5

* Best mutual funds exclude funds with TNAs less than $100 million for inadequate liquidity.
Sources: New Constructs, LLC and company filings
Five mutual funds are excluded from Figure 2 because their total net assets (TNA) are below $100 million and do not meet our liquidity minimums. See our mutual fund screener for more details.
Van Eck Market Vectors Semiconductor ETF (SMH) is the top-rated Information Technology ETF and Fidelity Select Communications Equipment Portfolio (FSDCX) is the top-rated Information Technology mutual fund. Both earn a Very Attractive rating.
First Trust Dow Jones Internet Index Fund (FDN) is the worst rated Information Technology ETF and Invesco Technology Sector Fund (IFOAX) is the worst rated Information Technology mutual fund. FDN earns a Dangerous rating and IFOAX earns a Very Dangerous rating.
506 stocks of the 3000+ we cover are classified as Information Technology stocks.
Cisco Systems (CSCO: $28/share) is one of our favorite stocks held by FSDCX and earns a Very Attractive rating. Cisco is on April’s Most Attractive Stocks list. Over the past decade, Cisco has grown after-tax profits (NOPAT) by 7% compounded annually. Cisco has improved its return on invested capital (ROIC) from 14% in 2005 to a top-quintile 17% in 2015. The company has generated a cumulative $32 billion in free cash flow (FCF) over the past five fiscal years. However, in spite of the operational strength exhibited by Cisco, CSCO is undervalued and presents an excellent buying opportunity. At its current price of $28/share, Cisco has a price-to-economic book value (PEBV) ratio of 0.8. This ratio means that the market expects Cisco’s NOPAT to permanently decline by 20%. If Cisco can grow NOPAT by just 6% compounded annually for the next decade, the stock is worth $43/share today – a 54% upside.
ServiceNow (NOW: $63/share) remains one of our least favorite stocks held by IFOAX and earns a Dangerous rating. ServiceNow was placed in the Danger Zone in November 2015. Since going public in 2012, ServiceNow’s NOPAT has declined from -$29 million to -$154 million while its ROIC declined from -29% to -41% over the same time frame. The drastic decline in profits and profitability is in stark contrast to ServiceNow’s revenue growth, as the company adopted a “grow revenue at all costs strategy,” which clearly ignores profits. Making matters worse, when we placed NOW in the Danger Zone, its valuation implied significant profit growth and despite NOW falling 21% since the publish date of our report, those expectations remain unrealistically high. To justify its current price of $63/share, ServiceNow must grow immediately achieve 15% pre-tax margins (-15% in 2015) and grow revenue by 23% compounded annually for 13 years. In this scenario, 13 years from now, ServiceNow would be generating over $14 billion in revenue, slightly below Facebook’s (FB) 2015 revenue. It’s clear how the expectations embedded in NOW remain overly optimistic.
Figures 3 and 4 show the rating landscape of all Information Technology ETFs and mutual funds.
Figure 3: Separating the Best ETFs From the Worst ETFs
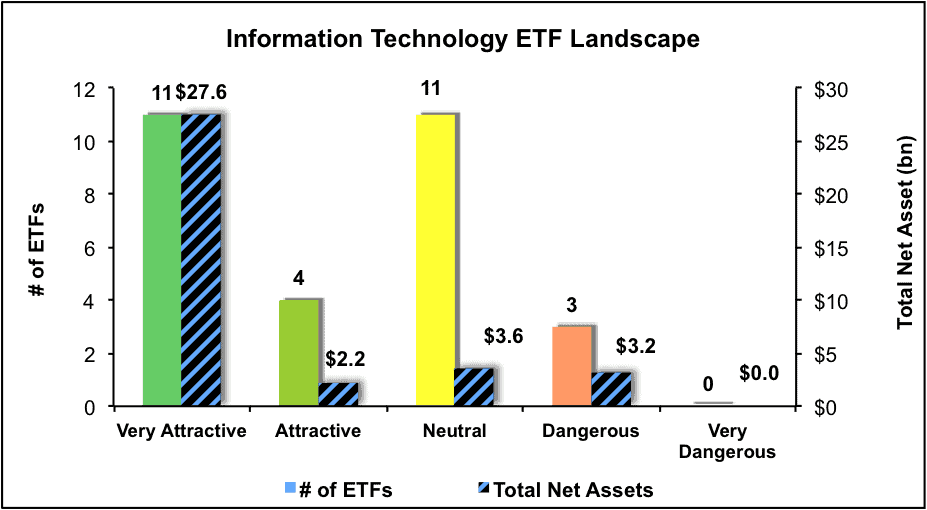
Sources: New Constructs, LLC and company filings
Figure 4: Separating the Best Mutual Funds From the Worst Mutual Funds
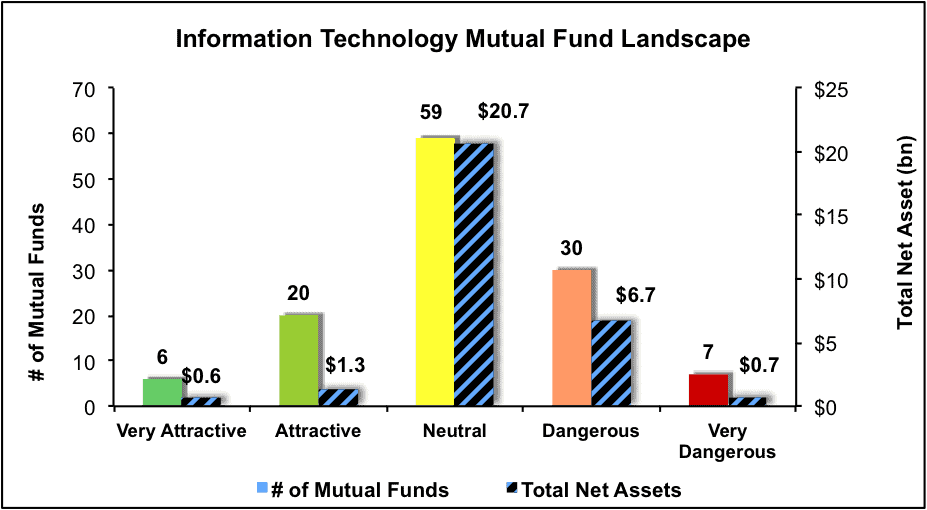
Sources: New Constructs, LLC and company filings
Disclosure: David Trainer and Kyle Guske II receive no compensation to write about any specific stock, sector or theme.
Click here to download a PDF of this report.
Photo Credit: Dboybaker(Flickr)