We closed this position on November 16, 2020. A copy of the associated Position Update report is here.
Check out this week’s Danger Zone interview with Chuck Jaffe of Money Life and Marketwatch.com
Just when we think the market is becoming more rational and beginning to focus on fundamentals again we find a stock that proves that idea wrong. Once again, we’ve identified a business that fails to generate profits, uses “adjusted” metrics as “better representations of business”, and who’s stock price is up over 200% since late 2012. ServiceNow (NOW: $81/share) is in the Danger Zone this week.
Revenue Growth At The Expense Of Profit
ServiceNow was founded in 2004 with the goal of managing and automating any number of information technology tasks in which enterprises may engage in day-to-day operations. As much as these services benefit clients, they do not serve the business or investors well. Figure 1 shows that despite strong revenue growth, ServiceNow’s after-tax profits (NOPAT) have declined from -$30 million in 2012 to -$166 million on a trailing twelve-month (TTM) basis.
Figure 1: Revenues Fail To Be Converted Into Profits
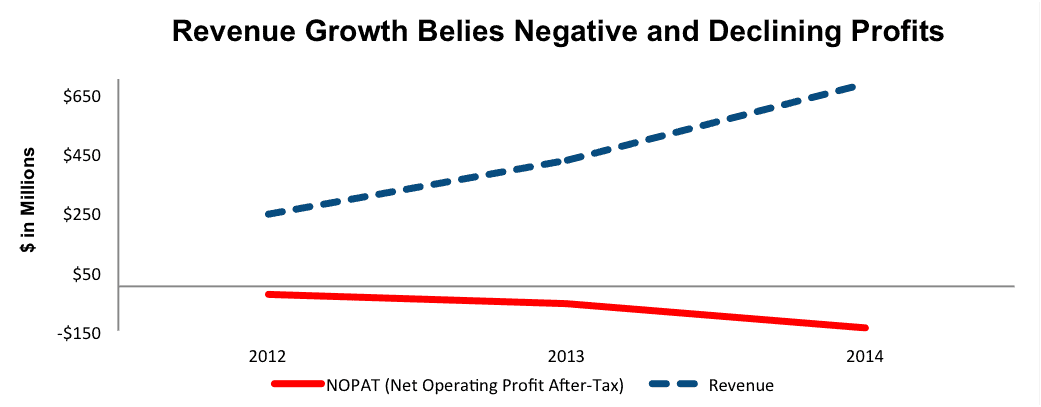
Sources: New Constructs, LLC and company filings
Costs Growing Much Faster Than Revenues
While revenues have grown at 67% compounded annually since 2012, sales & marketing, research & development, and general & administrative costs have grown at 81%, 94%, and 68% compounded annually respectively since 2012.
ServiceNow’s return on invested capital (ROIC) has followed the downward trend in profits and has declined from -28% in 2012 to its current bottom quintile -74% on a TTM basis.
We’ve seen this trend before in other cloud companies that we’ve also put in the Danger Zone: Marketo (MKTO), Proofpoint (PFPT), and Demandware (DWRE). Collectively, those three stocks are down an average -2% versus the S&P at +3% since they were put in the Danger Zone.
Adjusted Performance Metrics Help Execs At Expense of Investors
But wait how can this be? ServiceNow’s management directs attention to metrics that look good, for example: increasing annual contract values, growing billings, and excellent gross margins. What investors have failed to recognize, or chosen to ignore, is that these metrics divert focus off of the business’ increased losses. Even worse, the gross margin that ServiceNow highlights is calculated on a non-GAAP basis, a big red flag. What is the biggest adjustment made to arrive at NOW’s non-GAAP metrics? Removing stock based compensation (23% of revenue in the last fiscal year). Figure 2 shows the magnitude of this “adjustment”.
Figure 2: ServiceNow’s Stock Based Compensation
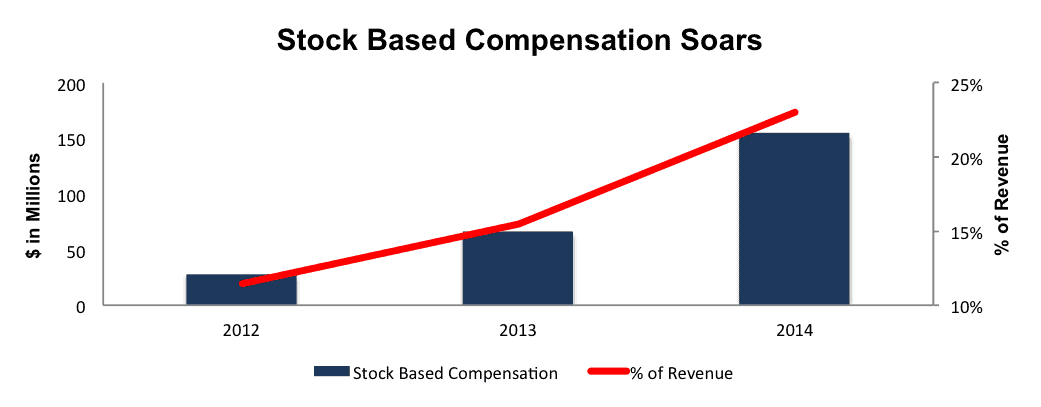
Sources: New Constructs, LLC and company filings
Since 2012, ServiceNow’s stock based compensation has grown from $27.9 million to $154.3 million in 2014. These costs represented 11% of revenue in 2012 and 23% of revenue in 2014. Don’t rely on adjusted numbers as they fail to present the true picture.
IT Automation Is a Crowded Market
Figure 3 shows that ServiceNow’s -74% ROIC is much lower than competition which gives it no pricing power and a weaker competitive position.
Figure 3: ServiceNow Doesn’t Match Up With Competition
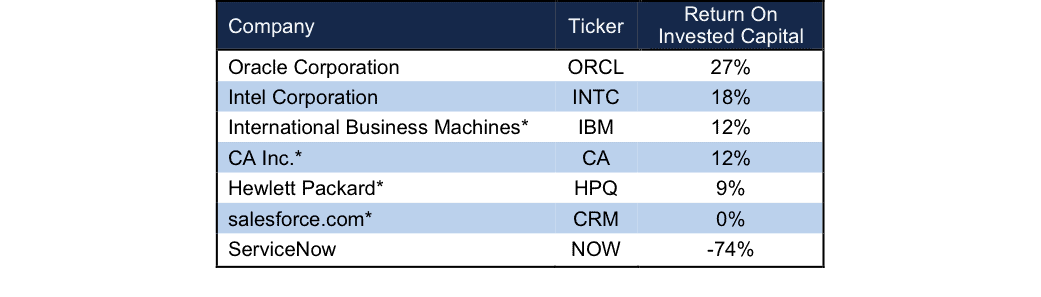
* Specifically identified as competitors in ServiceNow’s 2014 10-K filing
Sources: New Constructs, LLC and company filings
Bull Case Assumes Past Growth Continues Unabated
The bull case for ServiceNow rests on the belief that the company will achieve a large enough customer base that it can reduce customer acquisition costs and (profitably) serve that customer base for the foreseeable future. Much of the past customer growth ServiceNow achieved was due to being first to market with SaaS IT products while large competitors were content with deploying their legacy on-site solutions. The landscape has since changed, and ServiceNow has many direct competitors in the SaaS IT space. Those competitors, with their much larger resources, stand to make further growth for ServiceNow more difficult in the future than it was in the past.
For example, Hewlett Packard and IBM only released their IT cloud solutions in 2012 and CA Inc. released the same service in 2014. Instead of against more cumbersome, on-site, and expensive offerings, ServiceNow is going head-to-head with some of the biggest and best in software sales. These large competitors possess vast resources (cash) and operating advantages (larger scalable sales forces) that allow them to compete more aggressively on price, and, potentially turn the service into a commodity. ServiceNow can ill afford to enter a pricing war and win with its already severe lack of profitability.
Making matters worse, the current expectations baked into the stock price imply that ServiceNow not only continues the rapid growth (amidst increased competition) it has achieved in the past, but also takes majority market share from its entire potential market, which Morgan Stanley estimates to be ~$45 billion.
Valuation Has Nothing But Downside Risk
As noted earlier, NOW is up over 200% since going public and shares are greatly overvalued. To justify its current price of $81/share, ServiceNow must raise its pre-tax margin from -20% (TTM) to 10% and continue growing revenue by 31% compounded annually for the next 15 years. Put another way, the current market price implies that within 15 years ServiceNow would be generating $40 billion in revenue, which is the same level Oracle generated in 2014 and only $5 billion below its entire addressable market as noted above.
If we believe ServiceNow’s bulls are right and the company is able to increase margins upon reaching scale, shares are still overvalued. If ServiceNow achieves pretax margins of 15% (average of competition in Figure 2) and grows revenue by 24% compounded annually for the next decade, the stock is only worth $25/share today – a 69% downside.
As should be clear, the expectations baked into ServiceNow’s stock price are simply not rooted in reality.
Hidden Liabilities Make a Buyout Unlikely
With such a premium baked into NOW, it could be argued that investors expect the firm to be acquired. Apart from the issues above, ServiceNow has some hidden liabilities that make the company more expensive than the standard accounting numbers suggest:
- $225 million in off balance sheet operating leases (2% of market cap)
- $1 billion (8% of market cap) in outstanding employee stock options
In addition to these hidden liabilities, ServiceNow has $680 million in debt on a TTM basis, which represents 5% of market cap.
To determine a reasonable price that a suitor might pay for NOW, we analyzed a few of the most optimistic acquisition scenarios:
- Oracle acquires ServiceNow. Upon acquisition and assuming ServiceNow immediately achieves Oracle’s margins and ROIC, the company would still have to grow revenue by 32% compounded annually for the next 9 years to justify Oracle’s purchase at current prices. A more realistic price Oracle may pay is $12/share, which is the value of NOW’s business based on the value of the firm if it achieves ORCL’s 29% NOPAT margin in year 1 of the acquisition.
- CA Inc. acquires ServiceNow. Again, assuming upon acquisition ServiceNow immediately achieves CA’s margins and ROIC, the company would still have to grow revenue by 41% compounded annually for the next 11 years to justify CA’s purchase at current prices. A more realistic price CA may pay is $8/share, which is the value of NOW’s business based on the value of the firm if it achieves CA’s 22% NOPAT margin in year 1 of the acquisition.
Momentum Will Wear Off and Shares Will Sink
The momentum behind NOW since it went public in 2012 has been pretty impressive. Investors have continually ignored growing losses on the hopes that the company will someday “figure it out.” Over the next year, as revenue growth slows and profits remain illusive, we expect this trend to change. Businesses that don’t create profit aren’t long for the market, as eventually rationality wins out. We’ve have seen this story play out numerous times before with DWRE, Groupon (GRPN), and even Twitter (TWTR), all three were big momentum stocks that are now down 22%, 39%, and 21% respectively since we placed them in the Danger Zone. While the market’s irrationality can seem unlimited at times, investor appetite for risk tends not to be as large. While we cannot predict exactly when this stock will face reality, ServiceNow’s business model is clearly disconnected from its stock’s valuation, and we see no reason to believe it fare any better than the numerous other cloud service providers who also fail to make any profits.
Insider Sales/Short Interest Raise Red Flags
Over the past 12 months 157,000 shares have been purchased and 6.9 million shares have been sold for a net effect of 6.7 million insider shares sold. These sales represent 4% of shares outstanding. Additionally, there are 8 million shares sold short, or 5% of shares outstanding. It looks like insiders and some short sellers already see the writing on the wall.
Executive Compensation Is Misaligned With Shareholder Value Creation
ServiceNow’s executive compensation system rewards cash bonuses and equity awards for meeting target annual contract values. Despite growing losses, executives’ salary and bonuses have only increased in recent years. Herein lies the problem with executives basing their pay on metrics that don’t truly measure business success, a red flag we’ve raised again in a recent report. We would much rather see executive compensation tied to ROIC rather than a company-created metric that can look good even while the company is destroying shareholder value.
Impact of Footnotes Adjustments and Forensic Accounting
We have made several adjustments to ServiceNow’s 2014 10-K. The adjustments are:
Income Statement: we made seven adjustments with a net effect of removing $38 million of non-operating expenses (6% of revenue). We removed $5 million in non-operating income and $44 million in non-operating expenses.
Balance Sheet: we made $1.1 billion of balance sheet adjustments to calculated invested capital with a net decrease of $635 million. The largest adjustment was the inclusion of $225 million due to off balance sheet operating leases. This adjustment represented 25% of reported net assets.
Valuation: we made $2.6 billion of shareholder value adjustments with a net decrease of $877 million. The largest adjustment to shareholder value was the removal of $1 billion in outstanding employee stock options. This adjustment represented 8% of ServiceNow’s market cap.
Dangerous Funds That Hold NOW
The following fund receives our Dangerous rating and allocates significantly to ServiceNow.
- BNY Mellon Focused Equity Opportunities Fund (MFOIX) – 4.9% allocation and Dangerous rating
- Westcore Select Fund (WTSLX) – 3.8% allocation and Very Dangerous rating
- Wells Fargo Advantage Specialized Technology Fund (WFSTX) – 3.7% allocation and Very Dangerous rating
Disclosure: David Trainer and Kyle Guske II receive no compensation to write about any specific stock, style, or theme.