
Hunting for bargains is a best practice in any endeavor. But when it comes to investing, a cheap fund is not necessarily a good fund. A fund that has done well in the past is not guaranteed to do well in the future (e.g. 5-star kiss of death) and active management has a long history of underperformance. Most research focuses on finding funds with low fees and impressive past performance. Future returns, however, are determined primarily by a fund’s current holdings – not past performance.
Proprietary Robo-Analyst technology[1] empowers our unique ETF and mutual fund rating methodology, which leverages a rigorous analysis of fund holdings[2] and enables investors to find funds with high-quality holdings AND low fees. More reliable & proprietary fundamental data, as shown in The Journal of Financial Economics and proven to generate a new source of alpha, drives our research.
Investors are good at picking cheap funds. We want them to be better at picking funds with good stocks. Both are required to maximize success. Our predictive fund ratings make finding such funds easier than ever. A fund’s predictive rating is based on its holdings, its total costs, and how it ranks when compared to the universe of over 7,000 ETFs and mutual funds we cover.
Figure 1 shows that 86% of fund assets are in ETFs and mutual funds with low costs but only 0.1% of assets are in ETFs and mutual funds with attractive holdings. This discrepancy is eye-opening.
Figure 1: Allocation of Fund Assets by Holdings Quality and Costs
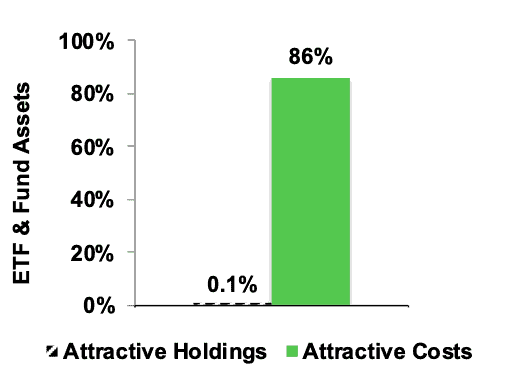
Sources: New Constructs, LLC and company filings
We see two key opportunities for improvement in the ETF and mutual fund industry:
- More research into the quality of holdings.
- Not enough research focuses on the quality of portfolio management of funds
- More allocation by managers to good stocks.
- With about twice as many funds as stocks in the market, there are simply not enough good stocks to fill all the funds.
These opportunities are related. If investors had more insight into the quality of funds’ holdings, we think they would allocate a lot less money to funds with poor-quality holdings. Many funds would cease to exist.
Quality of holdings is the single most important factor in determining an ETF or mutual fund’s future performance. No matter how low the costs, if the ETF or mutual fund holds bad stocks, performance will be poor. Costs are easier to find, but research on the quality of holdings is almost non-existent.
Figure 2 shows investors are not putting enough money into ETFs and mutual funds with high-quality holdings. Only 62 out of 7,263 (1%) ETFs and mutual funds earn an Attractive-or-better Portfolio Management Rating. 99% of assets are in funds that do not justify their costs and overcharge investors for poor portfolio management.
Figure 2: Distribution of ETFs & Mutual Funds By Portfolio Management Rating
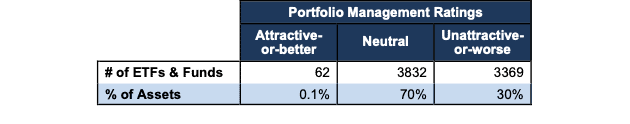
Source: New Constructs, LLC and company filings
Figure 3 shows that investors successfully find low-cost funds because 86% of assets are held in ETFs and mutual funds that have Attractive-or-better rated total annual costs (TAC), our apples-to-apples measure of the all-in cost of investing in any given fund.
Out of the 7,263 ETFs and mutual funds we cover, 2,834 (39%) earn an Attractive-or-better TAC rating. One example of a low-cost fund that rates poorly overall is the iShares Morningstar Small Cap Growth ETF (ISCG), which gets an overall predictive rating of Very Unattractive. Even with low fees of 0.07%, we expect the fund to underperform because it holds too many Unattractive-or-worse rated stocks. Low fees cannot boost fund performance, only good stock-picking can do that.
Figure 3: Distribution of ETFs & Mutual Funds By Total Annual Costs Ratings
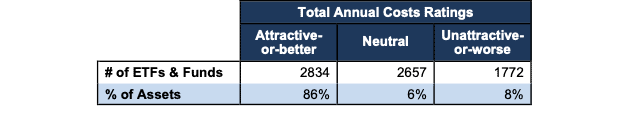
Source: New Constructs, LLC and company filings
Investors should allocate their capital to funds with both high-quality holdings and low costs, as those offer investors the best performance potential.
But a large portion of investors fail to do so.
Figure 4 shows that 2,193 ETFs and mutual funds, which actually account for 60% of ETF and mutual fund assets, have low costs and high-quality holdings according to our predictive fund ratings, which are based on the quality of holdings and the all-in costs to investors.
Figure 4: Distribution of ETFs & Mutual Funds (Count & Assets) By Predictive Ratings

Source: New Constructs, LLC and company filings
Investors deserve forward-looking ETF and mutual fund research that assesses both costs and quality of holdings. For example, Vanguard Value Index Fund (VTV) has both low costs and quality holdings.
Why is the most popular fund rating system based on backward-looking performance?
We do not know, but we do know that the lack of transparency into the quality of portfolio management provides cover for the ETF and mutual fund industry to continue to overcharge investors for poor portfolio management. How else could they get away with selling so many Unattractive-or-worse ETFs and mutual funds?
The late John Bogle was correct — investors should not pay high fees for active portfolio management. His index funds provided investors with many low-cost alternatives to actively managed funds. However, by focusing entirely on costs, he overlooked the primary driver of fund performance: the stocks held by funds. Investors also need to beware of certain Index Label Myths.
Research on the portfolio management of funds empowers investors to make better investment decisions. Investors should no longer pay for poor portfolio management.
This article was originally published on January 27, 2023.
Disclosure: David Trainer, Kyle Guske II, Matt Shuler, and Italo Mendonça receive no compensation to write about any specific stock, sector or theme.
Follow us on Twitter, Facebook, LinkedIn, and StockTwits for real-time alerts on all our research.
[1] Harvard Business School features our research automation technology in the case Disrupting Fundamental Analysis with Robo-Analysts.
[2] See how our models overcome flaws in Bloomberg and Capital IQ’s (SPGI) analytics in the detailed appendix of this paper.