
Corporate profits, when properly measured, have been much less volatile than implied by GAAP earnings since the first quarter of 2020.
This report is an abridged version of S&P 500 & Sectors: Core Earnings Vs. GAAP Earnings Through 3Q21, one of our quarterly series of reports on fundamental market and sector trends. The full version of the report analyzes Core Earnings[1],[2] and GAAP earnings for the S&P 500 and each of its sectors (last quarter’s analysis is here). These reports are available to those with a Pro or higher membership or can be purchased here.
Generally Accepted Accounting Distortions
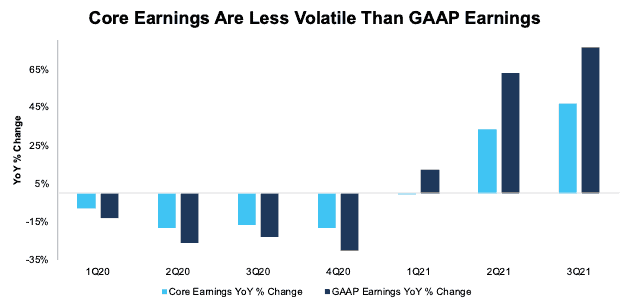
Figure 1 below shows Core Earnings, which adjust for unusual gains/losses, are less volatile than GAAP earnings. For instance:
- In 2020, GAAP earnings fell 30% YoY compared to an 18% fall for Core Earnings.
- In 2021, GAAP earnings rose 81% through 3Q21 compared to a 46% rise for Core Earnings.
At the end of 2020, Core Earnings of $1.1 trillion were 21% higher than GAAP earnings of $877 billion. Now, at $1.5 trillion, Core Earnings are 3% less than GAAP earnings of $1.6 trillion.
Figure 1: S&P 500 Core Earnings Vs. GAAP Earnings YoY Percent Change: 1Q20 – 3Q21
Sources: New Constructs, LLC and company filings.
Our Core Earnings analysis is based on aggregated TTM data for the sector constituents in each measurement period.
The November 16, 2021 measurement period incorporates the financial data from calendar 3Q21 10-Qs, as this is the earliest date for which all the calendar 3Q21 10-Qs for the S&P 500 constituents were available.
Our research leverages more reliable fundamental data[3] that overcomes flaws with legacy fundamental datasets to provide a more informed view of the fundamentals of companies and a new source of alpha.
2021 GAAP Earnings Widely Overstated
For 220 companies in the S&P 500, forty-four percent, GAAP Earnings overstate Core Earnings for the trailing-twelve-months (TTM) ended calendar 3Q21. Shockingly, when GAAP Earnings overstate Core Earnings, they do so by an average of 534% per company, per Figure 2. The overstatement was more than ten percent of GAAP Earnings for twenty-one percent of companies.
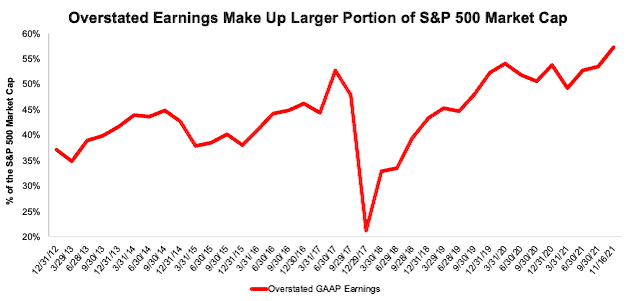
The 220 companies with overstated GAAP earnings make up 57% of the market cap of the S&P 500, which is the highest percent since 2012 (earliest data available). See Figure 3.
Figure 2: GAAP Earnings Overstated[4] by 534% On Average

Sources: New Constructs, LLC and company filings.
*Includes Southwest Airlines (LUV), which has GAAP Earnings overstated by 99,000+%. If we remove LUV, average overstated % is 90%.
Figure 3: Overstated Earnings as % of Market Cap: 2012 through 11/16/21[5]
Sources: New Constructs, LLC and company filings.
Key Details on Select S&P 500 Sectors
Core Earnings rose on a year-over-year (YoY) basis for all eleven sectors of the S&P 500 in 3Q21, widening the improvement from nine sectors in the second quarter. The Energy sector saw the largest YoY percentage improvement in Core Earnings, which rose from $1.3 billion in 3Q20 to $34.5 billion in 3Q21.
The Technology sector generates the most Core Earnings of any sector and grew Core Earnings by 44% YoY in 3Q21. On the flip side, the Real Estate sector has the lowest Core Earnings, and the Consumer Non-cyclicals sector had the weakest YoY growth in 3Q21.
Below we highlight the Industrials sector and a stock with some of the most Earnings Distortion (i.e. overstated GAAP earnings) in the sector.
Sample Sector Analysis[6]: Industrials Sector
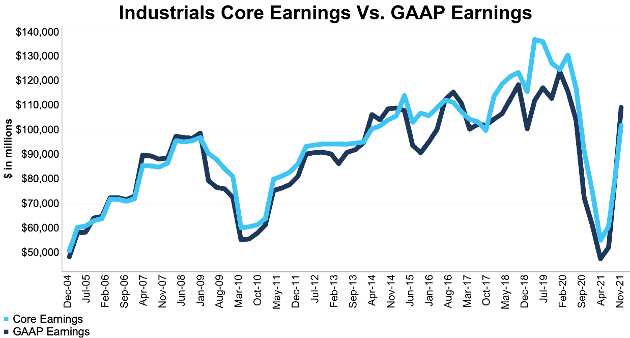
Figure 4 shows Core Earnings for the Industrials sector, at $101.7 billion, rose 36% YoY in 3Q21, while GAAP earnings, at $109.1 billion, rose 79% over the same time. Core Earnings and GAAP earnings were more severely impacted during COVID-19 than during the Financial Crisis but have recovered more quickly.
Figure 4: Industrials Core Earnings Vs. GAAP: 2004 – 3Q21
Sources: New Constructs, LLC and company filings.
Our Core Earnings analysis is based on aggregated TTM data for the sector constituents in each measurement period.
The November 16, 2021, measurement period incorporates the financial data from calendar 3Q21 10-Qs, as this is the earliest date for which all the calendar 3Q21 10-Qs for the S&P 500 constituents were available.
GAAP Earnings Overstatement Details: United Airlines (UAL)
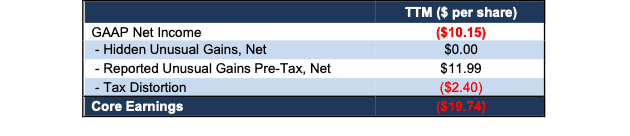
Below, we detail the hidden and reported unusual items that aren’t captured in GAAP Earnings but are captured in Core Earnings for United Airlines (UAL), a stock with some of the most Earnings Distortion, and therefore overstated GAAP Earnings in the Industrials sector. After adjusting for unusual items, we find that United’s Core Earnings of -$19.74/share are nearly 2x worse than reported GAAP Earnings of -$10.15/share. United Airlines’ Earnings Distortion Score is Strong Miss. Our stock rating for UAL is Very Unattractive.
Figure 5 details the differences between Core Earnings and GAAP Earnings so readers can audit our research.
Figure 5: United Airlines’ GAAP Earnings to Core Earnings Reconciliation
Sources: New Constructs, LLC and company filings.
Major sources of distortion for UAL – including federal grants from the CARES Act grants, severance and benefit costs, gains/losses on sale of assets, and impairment of assets detailed below – were bundled in “Special Charges (Credit)” on United Airlines’ income statement. We found the additional details in the management discussion and analysis section of the company’s filings.
More details:
Reported Unusual Gains Pre-Tax, Net = $11.99/per share, which equals $3.8 billion and is comprised of:
- $4.5 billion in other non-recurring income in the TTM period based on
- $1.1 billion in CARES Act grants in 3Q21
- $17 million in gains on sale of assets in 3Q21
- $1.1 billion in CARES Act grants in 2Q21
- -$61 million in losses on sale of assets in 2Q21
- $1.8 billion in CARES Act grants in 1Q21
- -$16 million in losses on sale of assets in 1Q21
- $453 million in CARES Act grants in 4Q20 (based on $3.5 billion in the 2020 10-K)
- $58 million in gains on sale of assets in 4Q20 (based on -$27 million losses on sale of assets in the 2020 10-K)
- $192 million in unrealized gains on investments in the TTM period based on
- -$34 million loss in 3Q21
- $147 million gain in 2Q21
- -$22 million loss in 1Q21
- $101 million gain in 4Q20
- -$58 million in miscellaneous expenses in the TTM period based on
- $20 million gain in 3Q21
- -$49 million expense in 2Q21
- -$19 million expense in 1Q21
- -$10 million expense in 4Q21
- -$91 million contra adjustment for recurring pension costs. These recurring expenses are reported in non-recurring line items, so we add them back and exclude them from Earnings Distortion.
- -$305 million in impairment of asset charges in the TTM period based on
- -$46 million in 3Q21
- -$59 million in 2Q21
- -$200 million in 4Q20
- -$595 million in severance and benefit costs in the TTM period based on
- -$5 million in 3Q21
- -$11 million in 2Q21
- -$417 million in 1Q21
- -$162 million in 4Q20
Tax Distortion = -$2.40/per share, which equals -$760 million
- We remove the tax impact of unusual items on reported taxes when we calculate Core Earnings. It is important that taxes get adjusted so they are appropriate for adjusted pre-tax earnings.
This article originally published on November 24, 2021.
Disclosure: David Trainer, Kyle Guske II, and Matt Shuler receive no compensation to write about any specific stock, style, or theme.
Follow us on Twitter, Facebook, LinkedIn, and StockTwits for real-time alerts on all our research.
Appendix: Calculation Methodology
We derive the Core Earnings and GAAP Earnings metrics above by summing the Trailing Twelve Month individual S&P 500 constituent values for Core Earnings and GAAP Earnings in each sector for each measurement period. We call this approach the “Aggregate” methodology.
The Aggregate methodology provides a straightforward look at the entire sector, regardless of market cap or index weighting and matches how S&P Global (SPGI) calculates metrics for the S&P 500.
[1] Core Earnings enable investors to overcome the flaws in legacy fundamental data and research, as proven in Core Earnings: New Data & Evidence, written by professors at Harvard Business School (HBS) & MIT Sloan for The Journal of Financial Economics.
[2] Based on the latest audited financial data, which is the 10-Q for calendar 3Q21 in most cases.
[3] Three independent studies prove the superiority of our data, models, and ratings. Learn more here.
[4] Overstated companies include all companies with Earnings Distortion >0.1% of GAAP earnings.
[5] Overstated GAAP Earnings equals Earnings Distortion >0.1% of GAAP Earnings.
[6] The full version of this report provides analysis for all eleven sectors.