
This report is an abridged and free version of All Cap Index & Sectors: Core Earnings Vs. GAAP Earnings Through 2Q21, one of the reports in our quarterly series on fundamental market and sector trends, which is available to Pro and higher members. More free reports are available here.
The full version of the report analyzes the Core Earnings[1] and GAAP earnings of the NC 2000[2], our All Cap Index, and each of its sectors (last quarter’s analysis is here). The most recent earnings values are based on the latest audited financial data, which is the calendar 2Q21 10-Q for most companies.
These reports leverage more reliable fundamental data[3] that overcomes flaws with legacy fundamental datasets. Our Earnings Distortion research has been shown to generate substantial idiosyncratic alpha.
Core Earnings Are Better than GAAP Earnings
Figure 1 shows Core Earnings for the NC 2000 are significantly less volatile than GAAP earnings. GAAP earnings fell 36% YoY in 2020, and have improved 86% since the end of 2020. Meanwhile, Core Earnings, which adjust for unusual gains/losses, fell just 19% YoY in 2020 and have grown only 39%.
At the end of 2020, Core Earnings of $1.2 trillion were 34% higher than GAAP earnings of $896 billion. Now, they are less than 1% higher than GAAP earnings ($1.67 trillion vs $1.66 trillion). Investors should take the GAAP earnings growth in 2021 with a grain of salt.
Figure 1: NC 2000 Core Earnings Vs. GAAP YoY Percent Change: 4Q19 – 2Q21
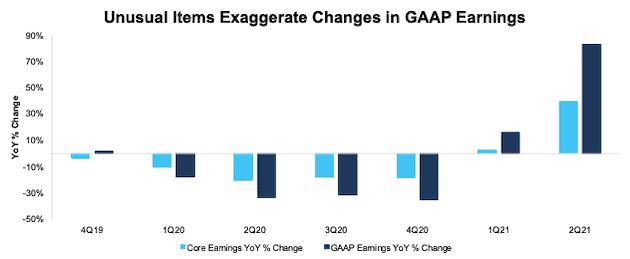
Sources: New Constructs, LLC and company filings.
Our Core Earnings analysis is based on aggregated TTM data for the sector constituents in each measurement period.
The August 18, 2021 measurement period incorporates the financial data from 2Q21 10-Qs, as this is the earliest date for which all the 2Q21 10-Qs for the NC 2000 constituents were available.
Key Details on Select NC 2000 Sectors
Within the NC 2000, all but one sector, (Energy) saw a year-over-year (YoY) rise in Core Earnings in 2Q21. The widespread improvement in Core Earnings continues from 1Q21, when all but three sectors saw a YoY increase in Core Earnings.
The Real Estate sector saw the largest percentage YoY improvement in Core Earnings, which rose from just $11.3 billion in 2Q20 to $30.4 billion in 2Q21.
The Basic Materials sector, at 145%, had the most overstated YoY change in GAAP earnings for 2Q21. However, not all stocks in the sector have overstated GAAP earnings.
Below we highlight the Basic Materials sector and a stock with some of the most negative Earnings Distortion (and therefore understated GAAP Earnings) in the sector.
Sample Sector Analysis[4]: Basic Materials
Figure 2 shows Core Earnings, at $63.7 billion, for the Basic Materials sector rose 78% YoY in 2Q21, while GAAP earnings, at $63.8 billion, rose 223% over the same time. Due to record asset write-downs through the first half of 2020, which artificially reduced GAAP earnings, the rebound in GAAP earnings looks much higher than Core Earnings.
Figure 2: Basic Materials Core Earnings Vs. GAAP: 4Q98 – 2Q21
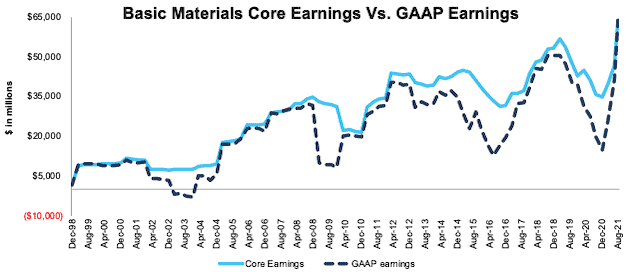
Sources: New Constructs, LLC and company filings.
Our Core Earnings analysis is based on aggregated TTM data for the sector constituents in each measurement period.
The August 18, 2021 measurement period incorporates the financial data from 2Q21 10-Qs, as this is the earliest date for which all the 2Q21 10-Qs for the NC 2000 constituents were available.
Core Earnings Distortion Details: Sonoco Products Company (SON)
Below, we detail the hidden and reported unusual items that aren’t captured in GAAP Earnings but are captured in Core Earnings for Sonoco Products Company (SON), a stock with some of the most negative Earnings Distortion in the Basic Materials sector. After adjusting for unusual items, we find that Sonoco’s Core Earnings of $3.11/per share are positive and greater than reported GAAP Earnings of -$1.88/per share. Our Earnings Distortion Score for SON is Strong Beat. Our stock rating for SON is Attractive.
Figure 3 details the differences between Core Earnings and GAAP Earnings so readers can audit our research.
Figure 3: Sonoco’s GAAP Earnings to Core Earnings Reconciliation

Sources: New Constructs, LLC and company filings.
More details:
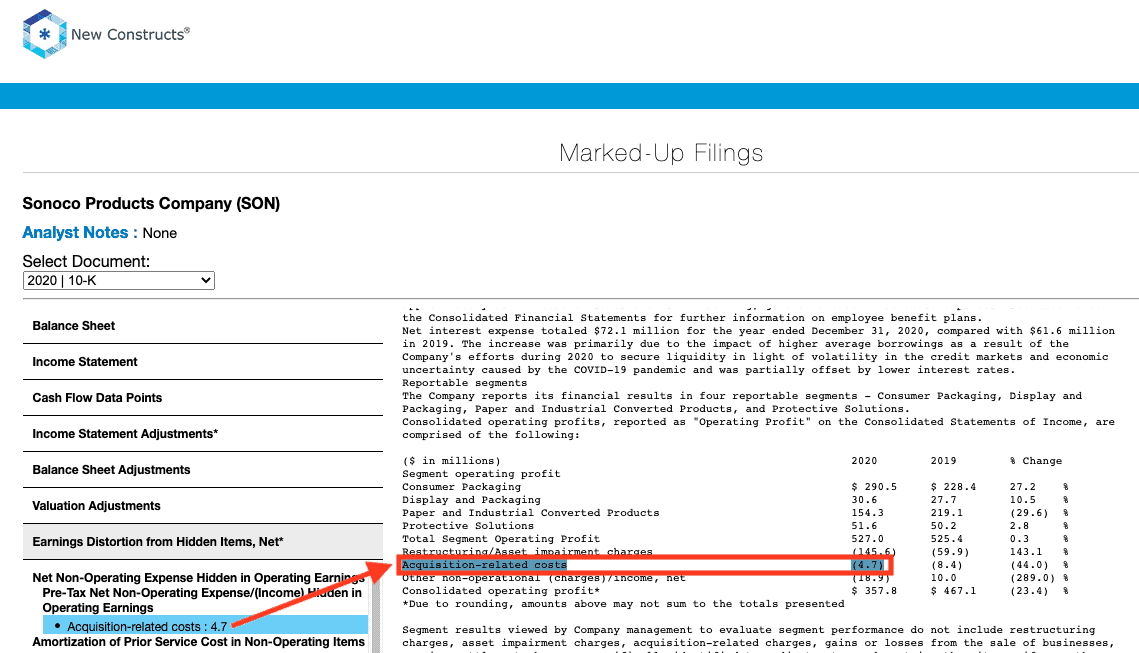
Hidden Unusual Expenses, Net = -$9 million or -$0.08/per share
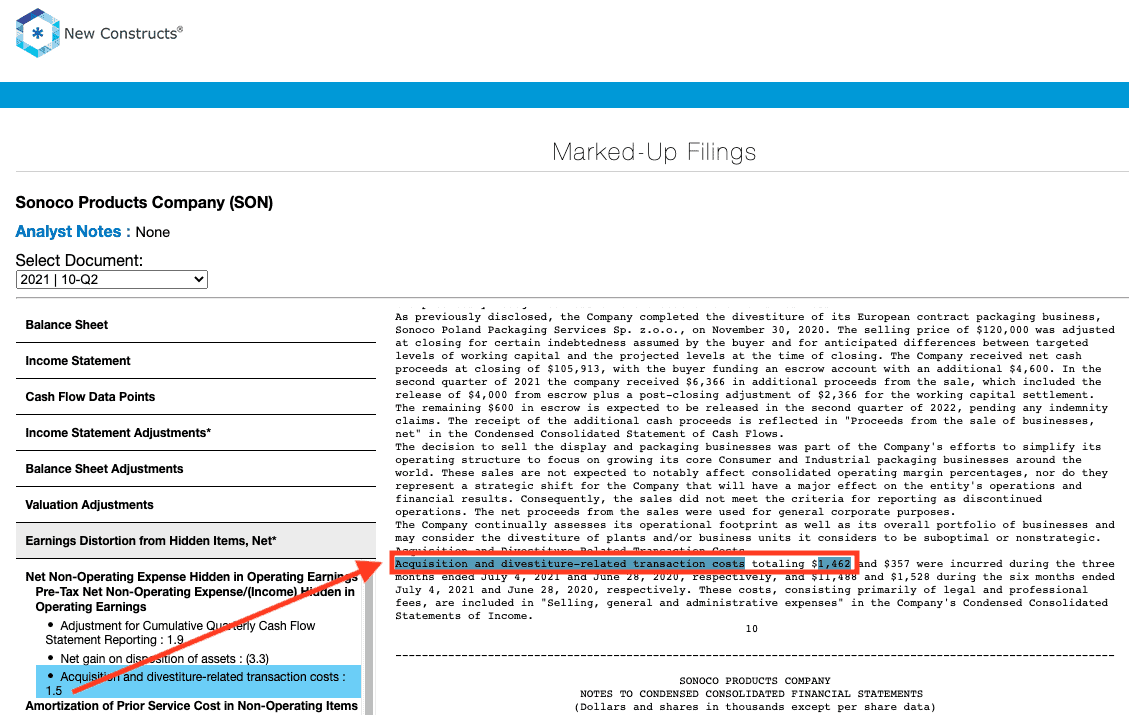
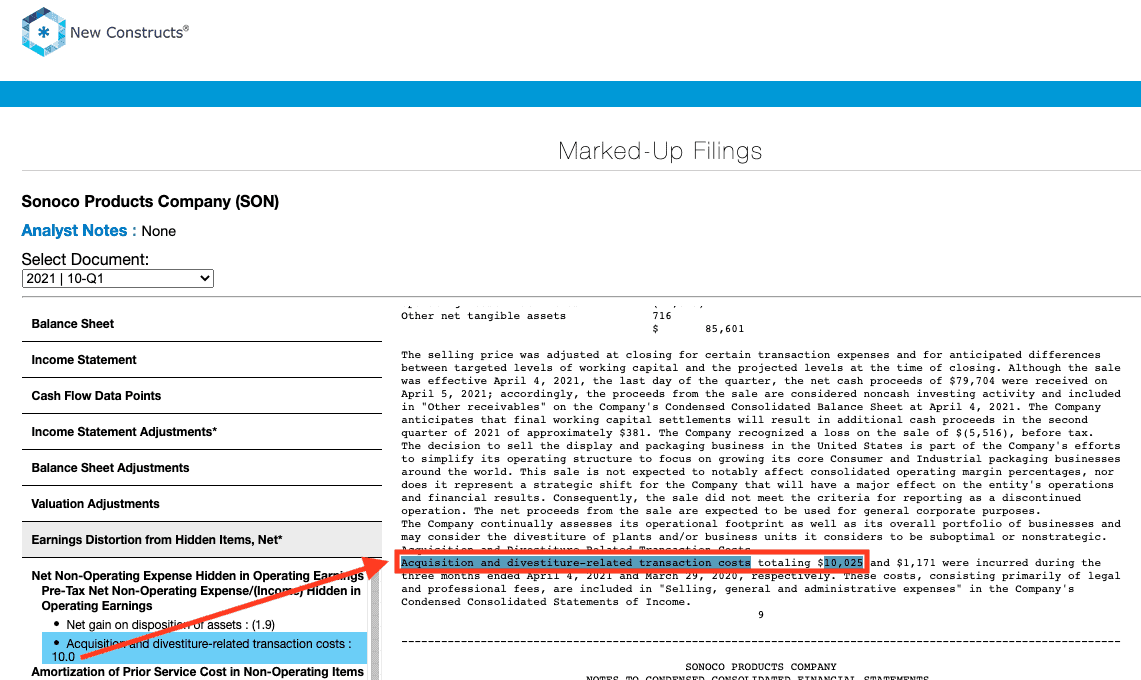
- -$14 million in acquisition and divestiture-related transaction costs in the TTM period, based on
- -$1.5 million costs in 2Q21
- -$10 million costs in 1Q21
- -$4.7 million costs in 20205
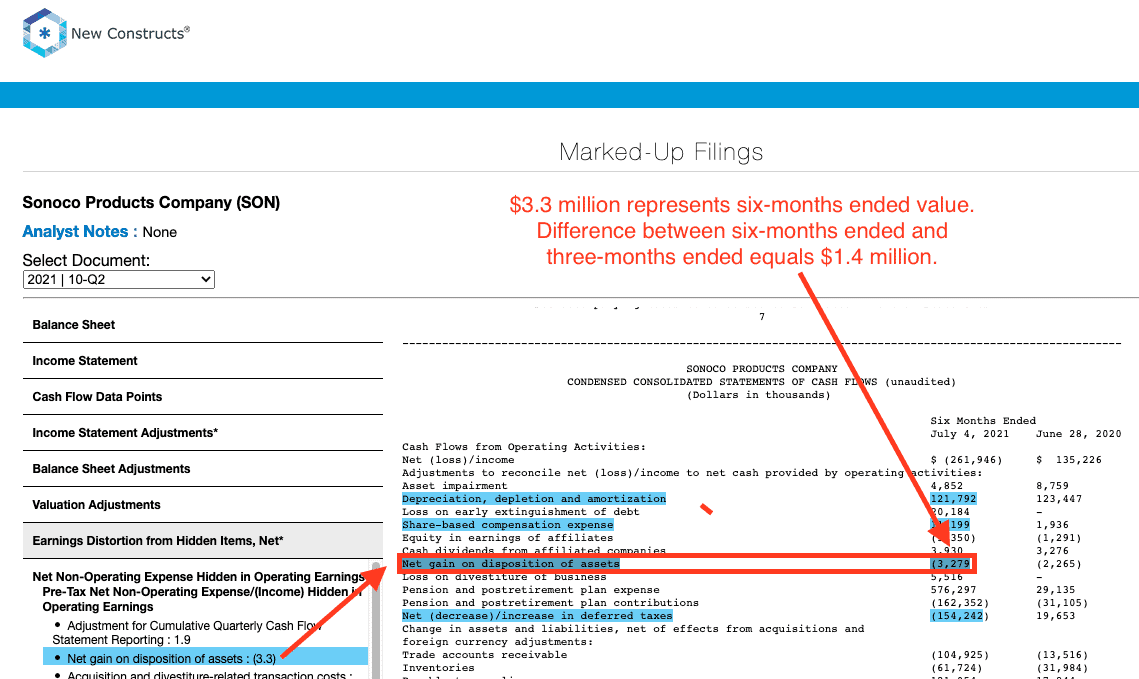
- $4 million in gains on disposition of assets in the TTM period, based on
- $1.4 million gain in 2Q21
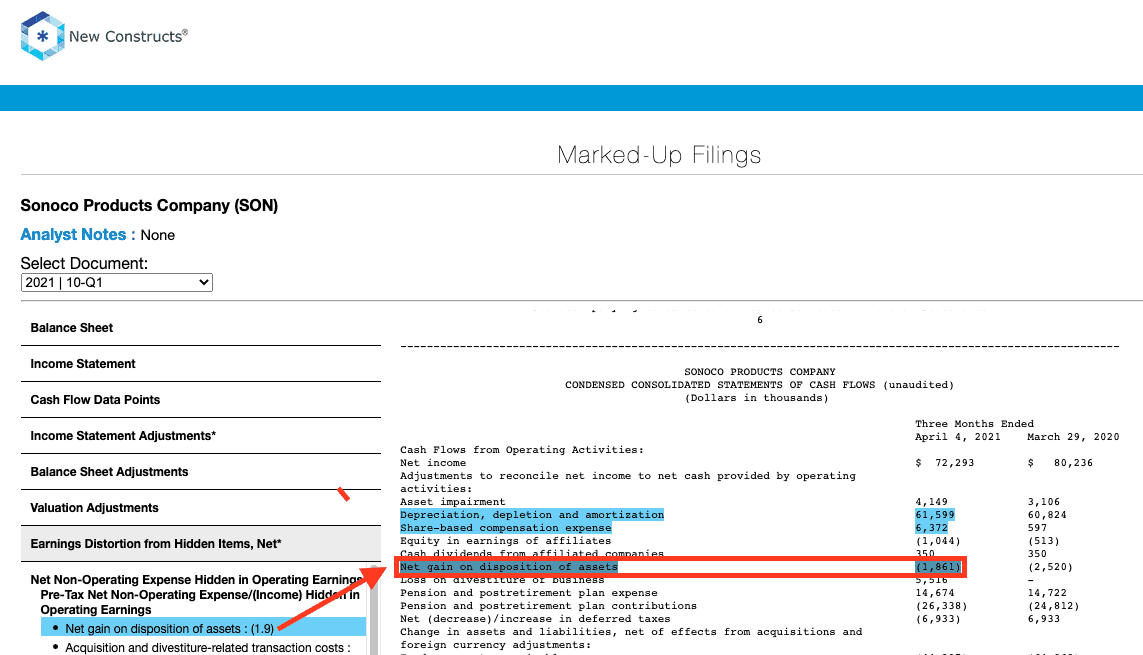
- $1.9 million gain in 1Q21
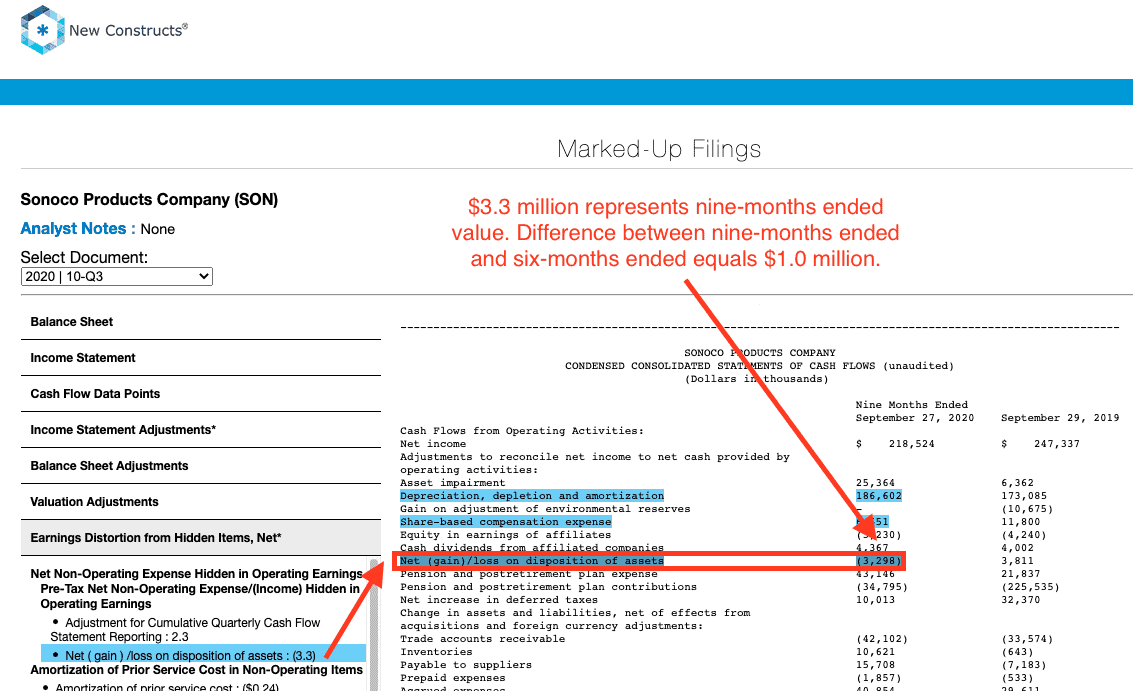
- $1.0 million gain in 3Q20
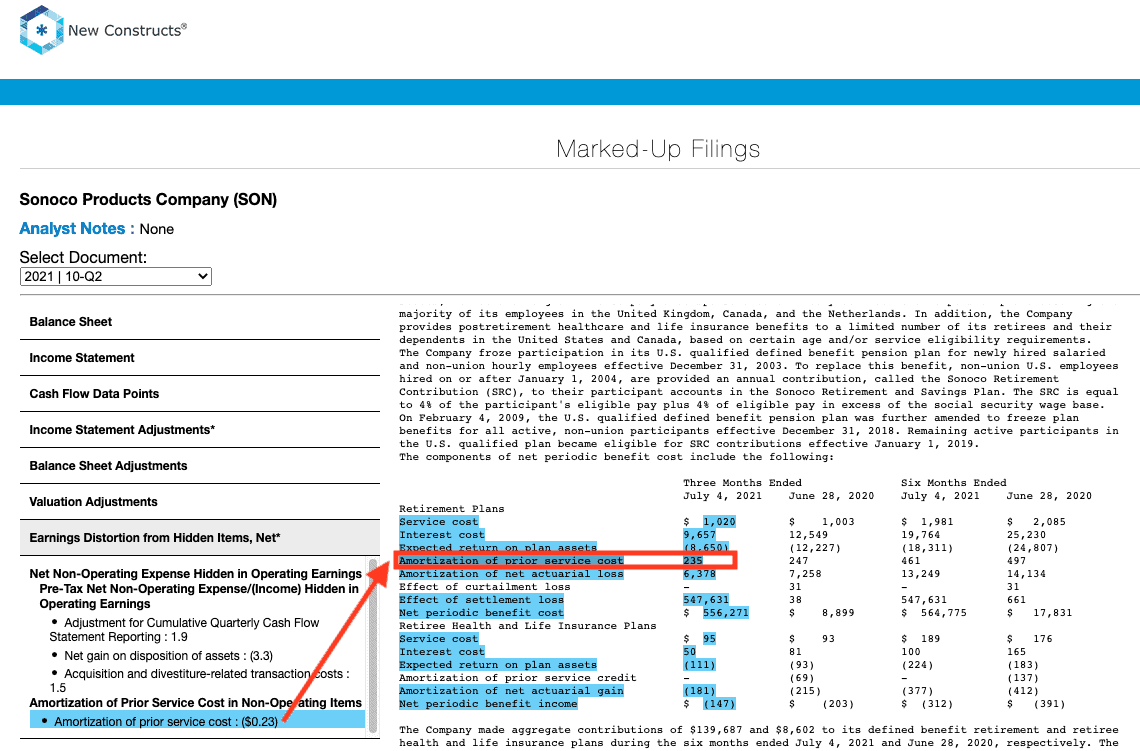
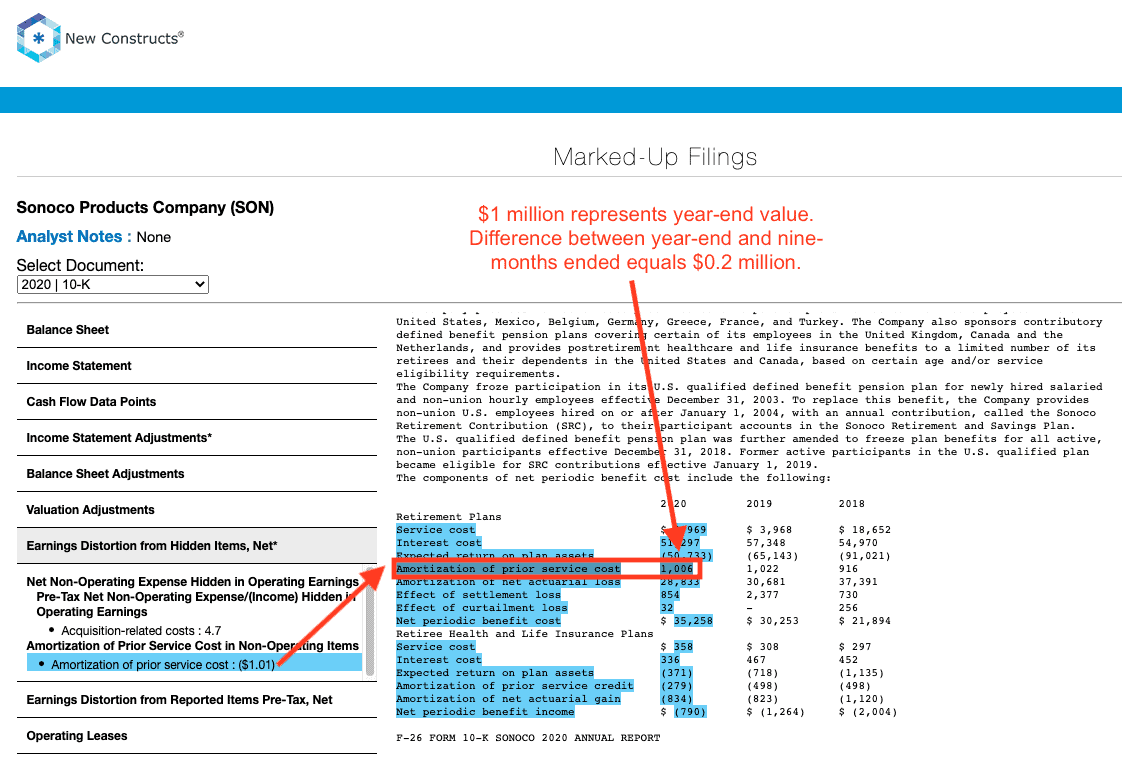
- $1 million in amortization of prior service costs in the TTM period, based on
- $0.2 million in 2Q21
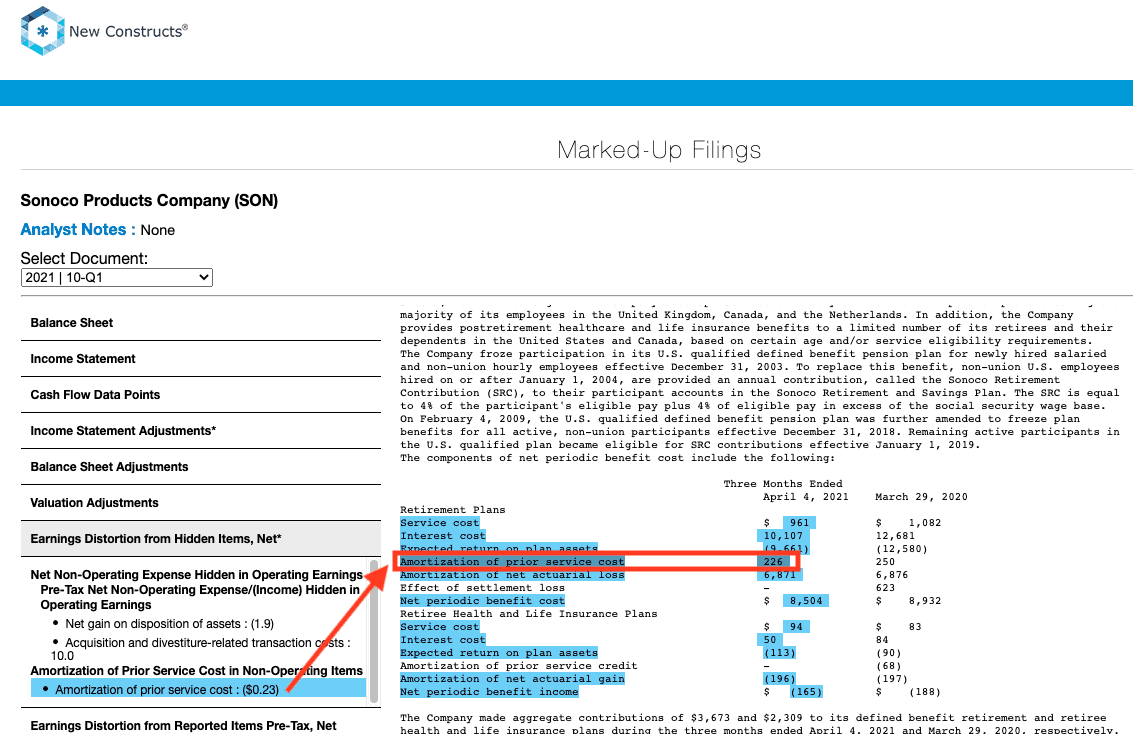
- $0.2 million in 1Q21
- $0.2 million in 4Q20
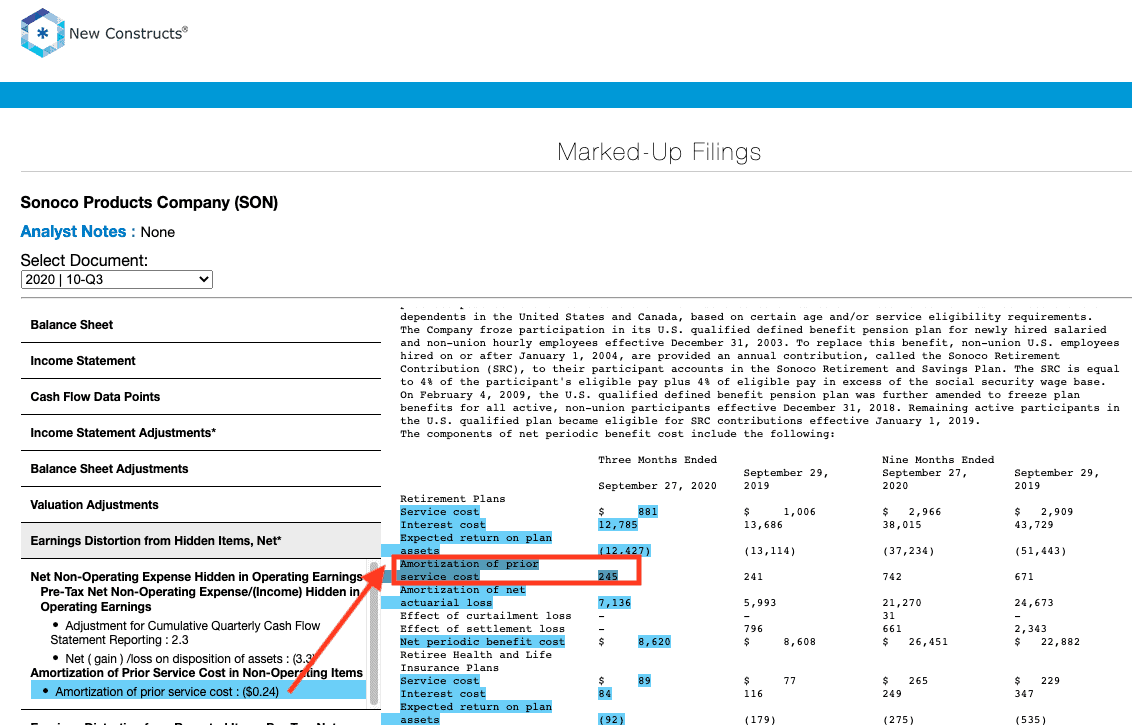
- $0.2 million in 3Q20
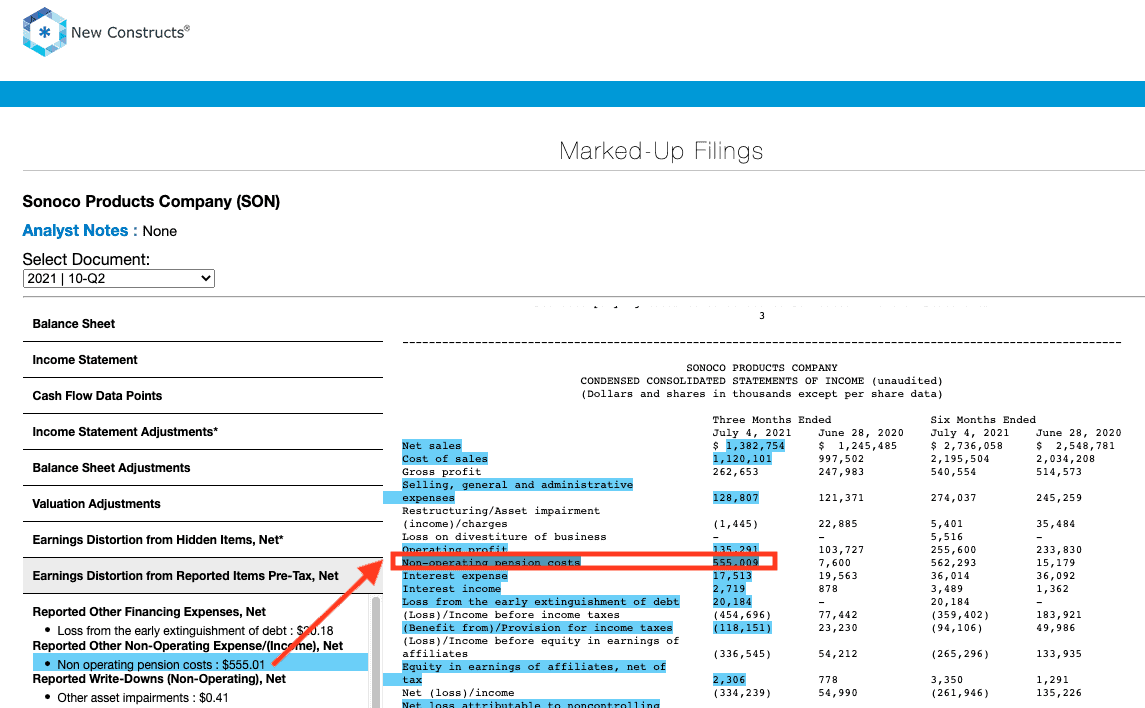
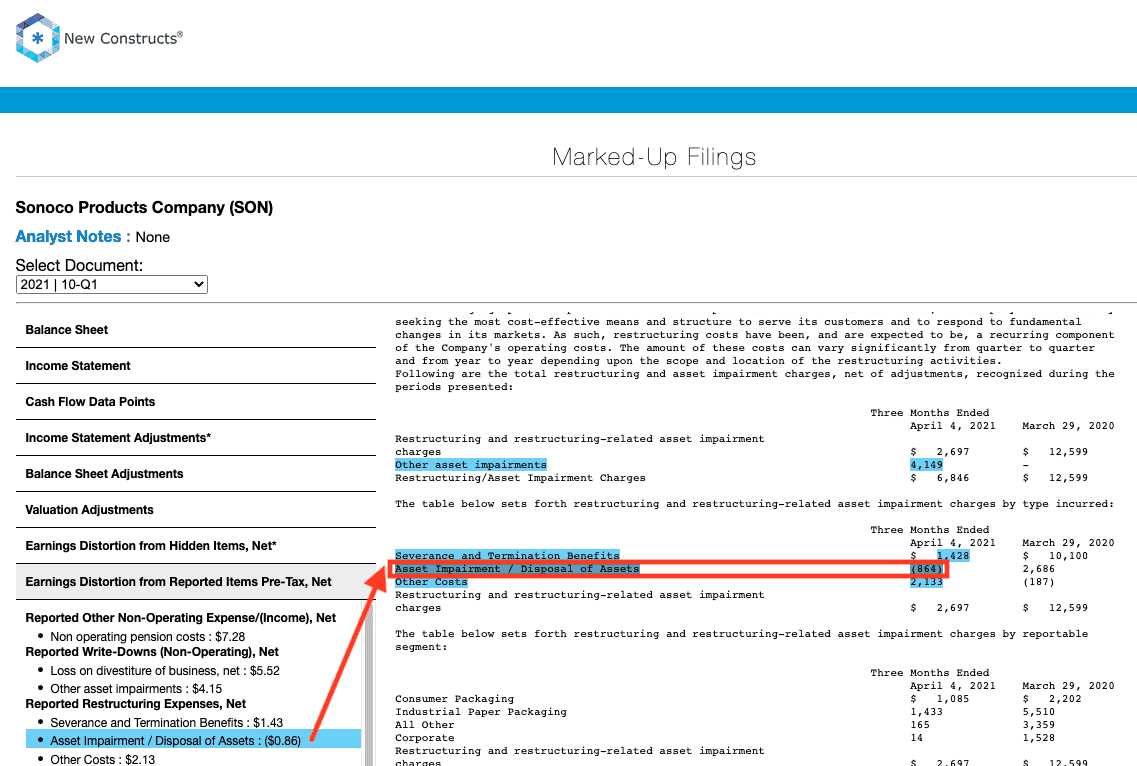
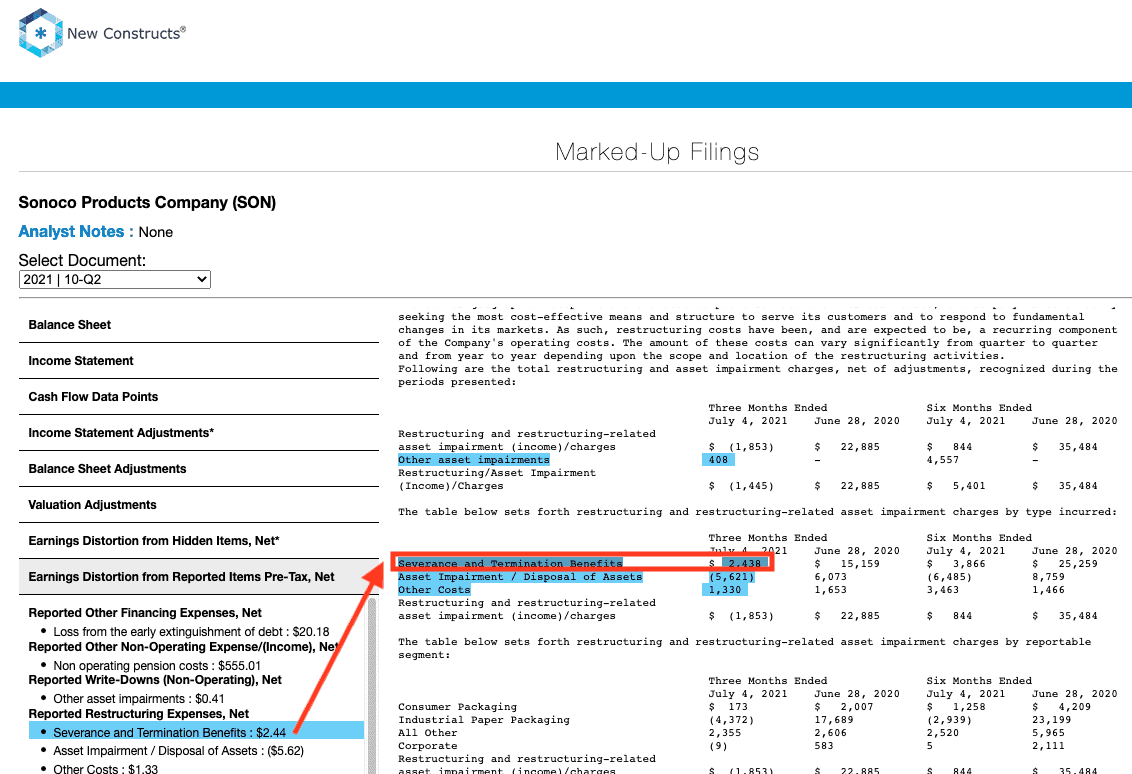
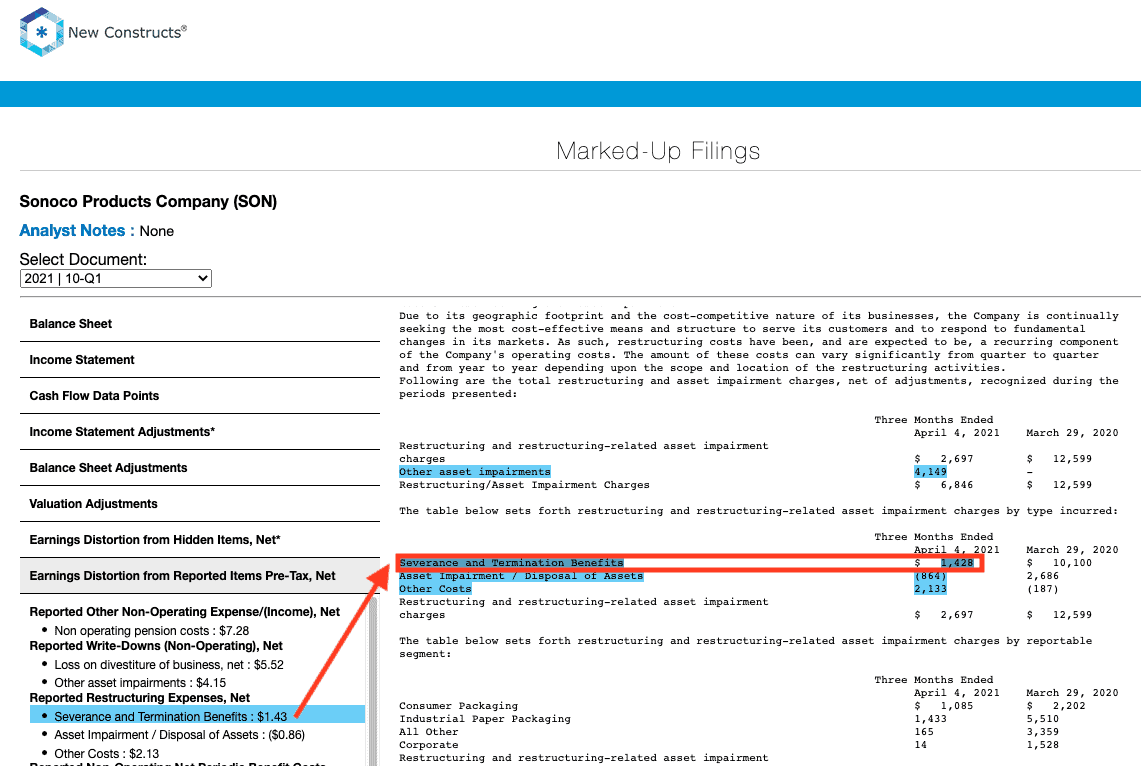
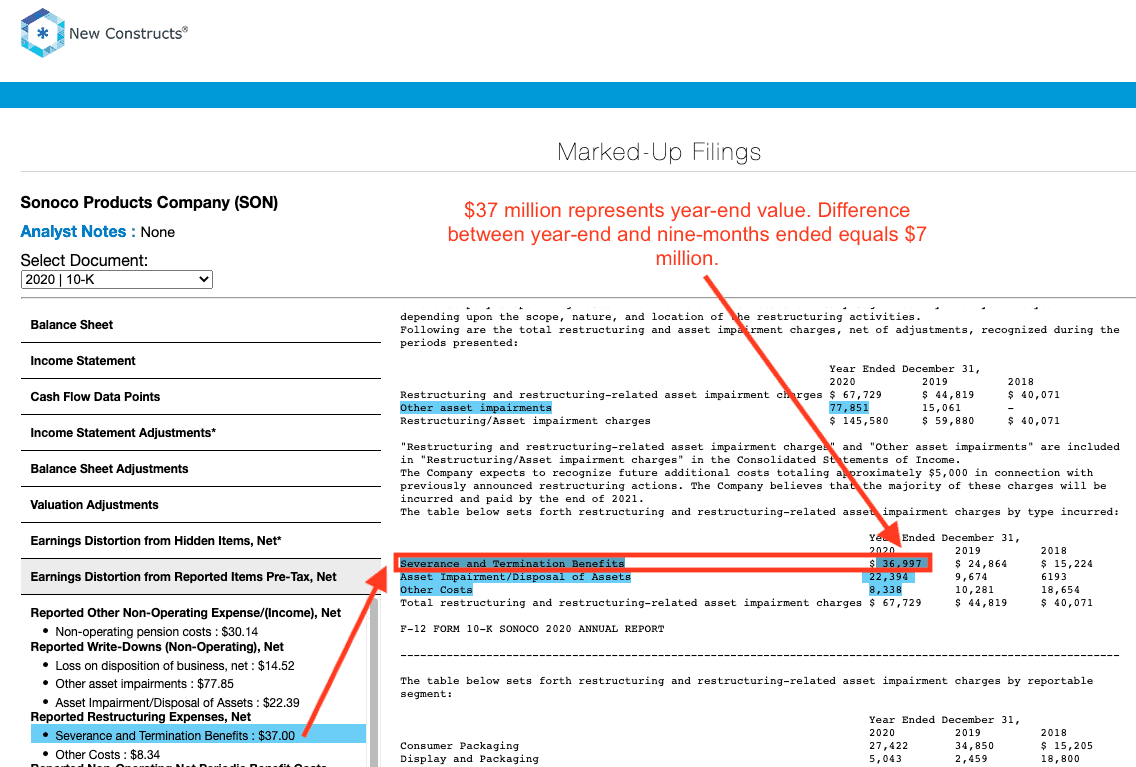
Reported Unusual Expenses Pre-Tax, Net = -$704 million or $6.97/per share
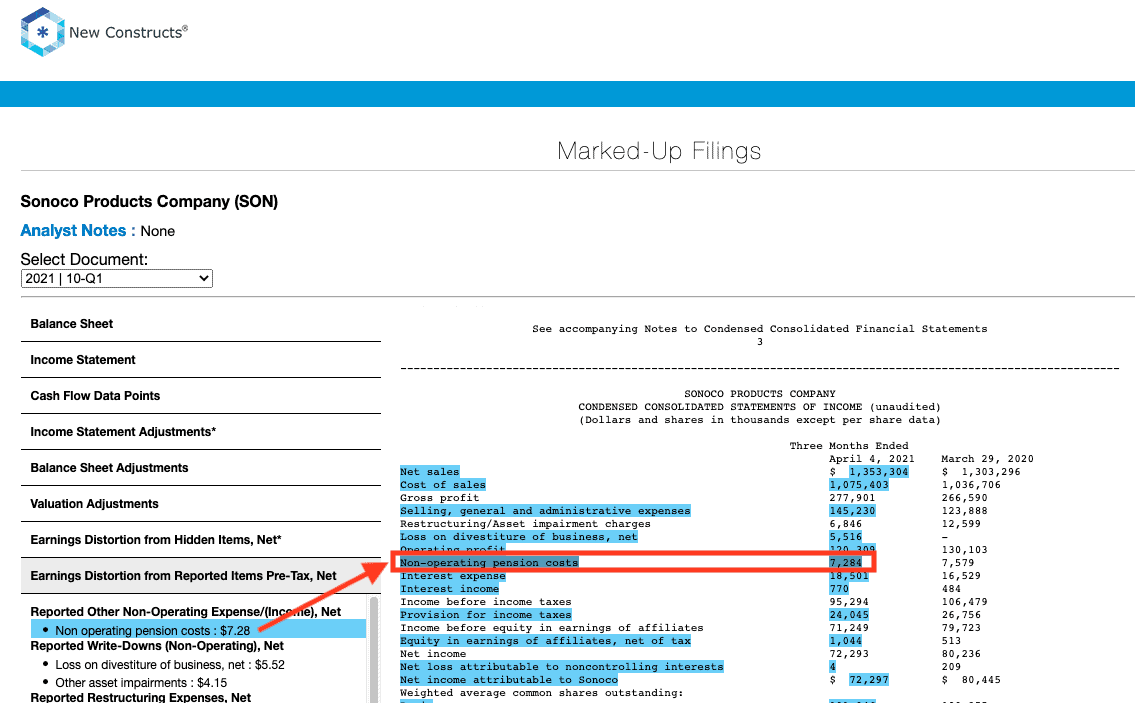
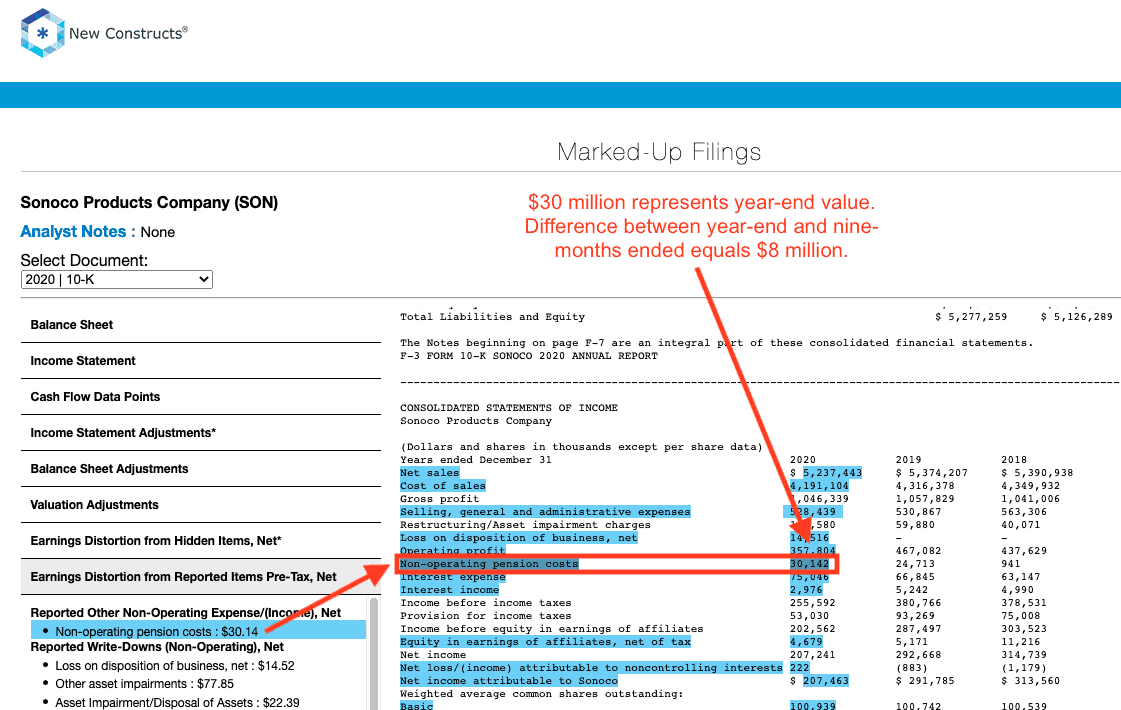
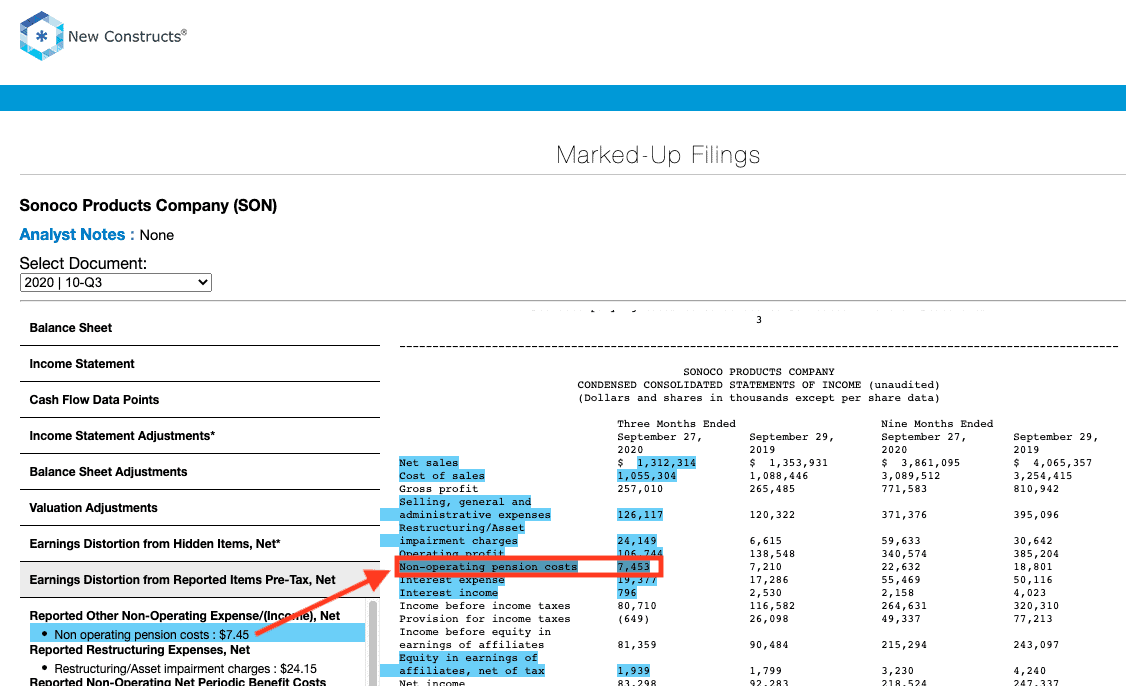
- -$577 million in non-operating pension costs in the TTM period, based on
- -$555 million in 2Q21
- -$7 million in 1Q21
- -$8 million in 4Q20
- -$7 million in 3Q20
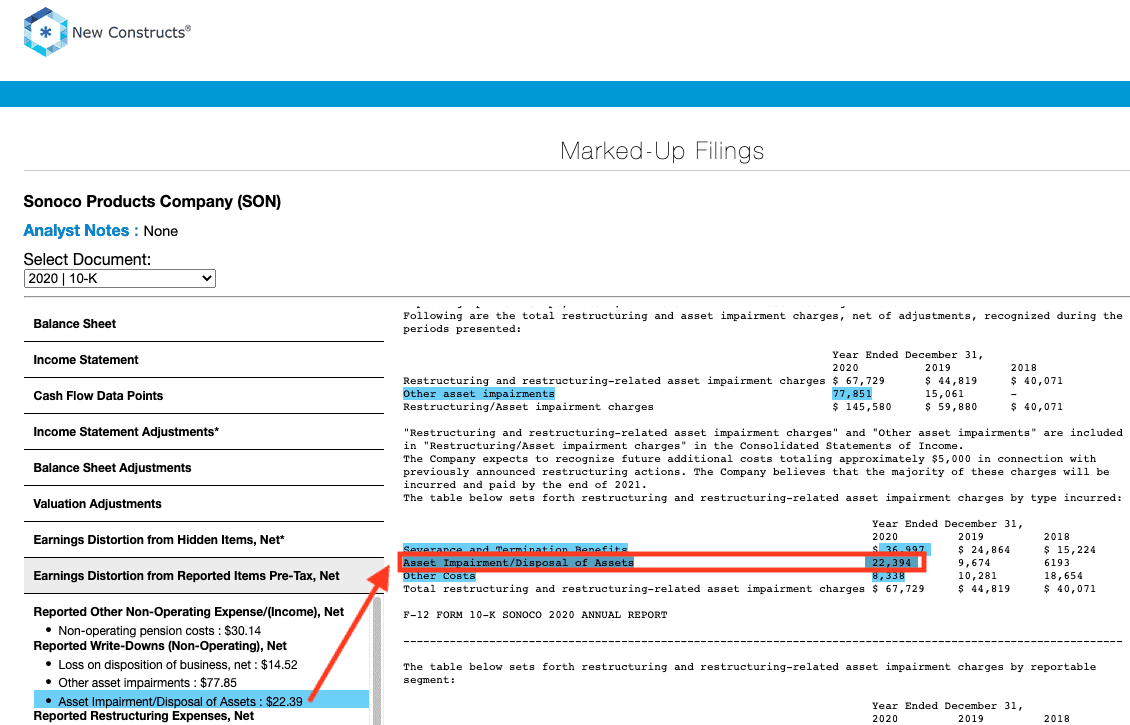
- -$125 million in asset-write downs in the TTM period, based on
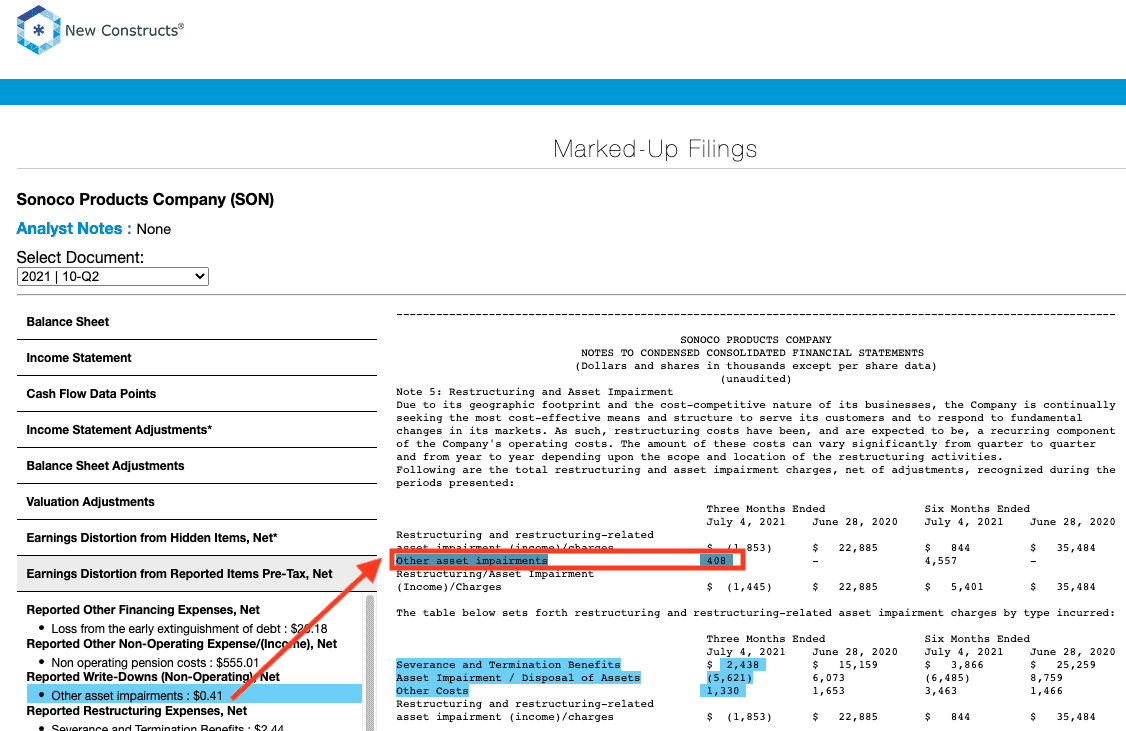
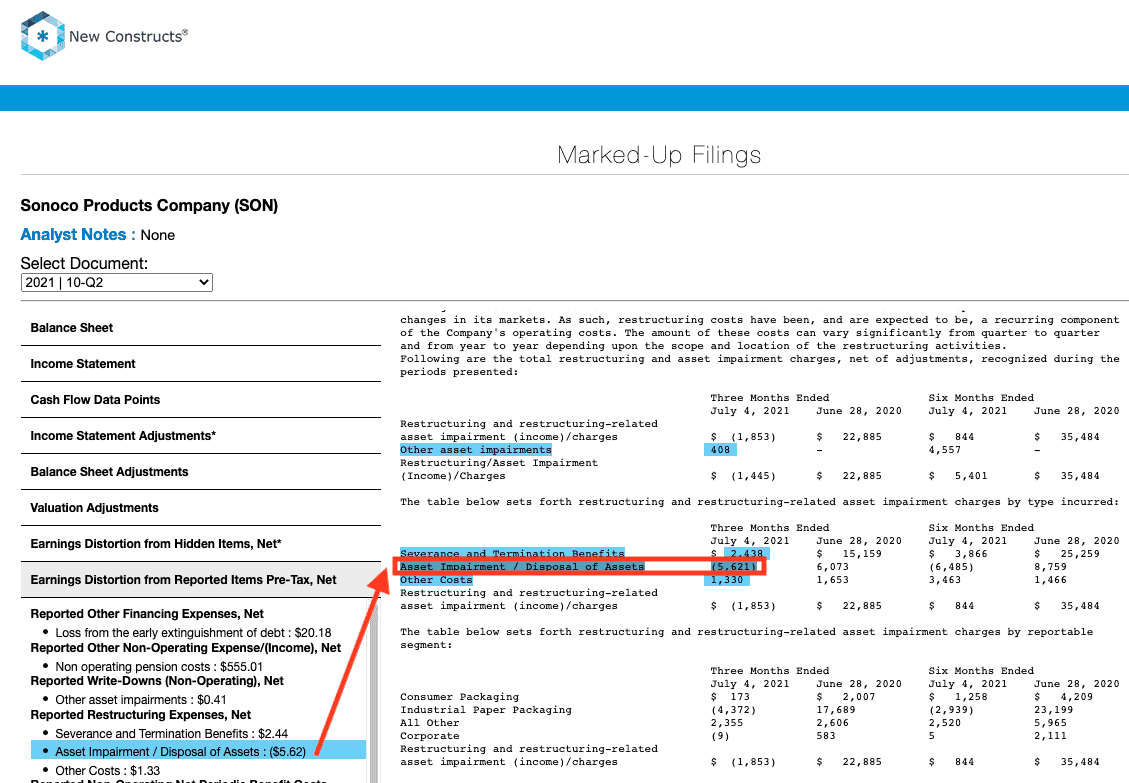
- -$0.4 million other asset impairments in 2Q21
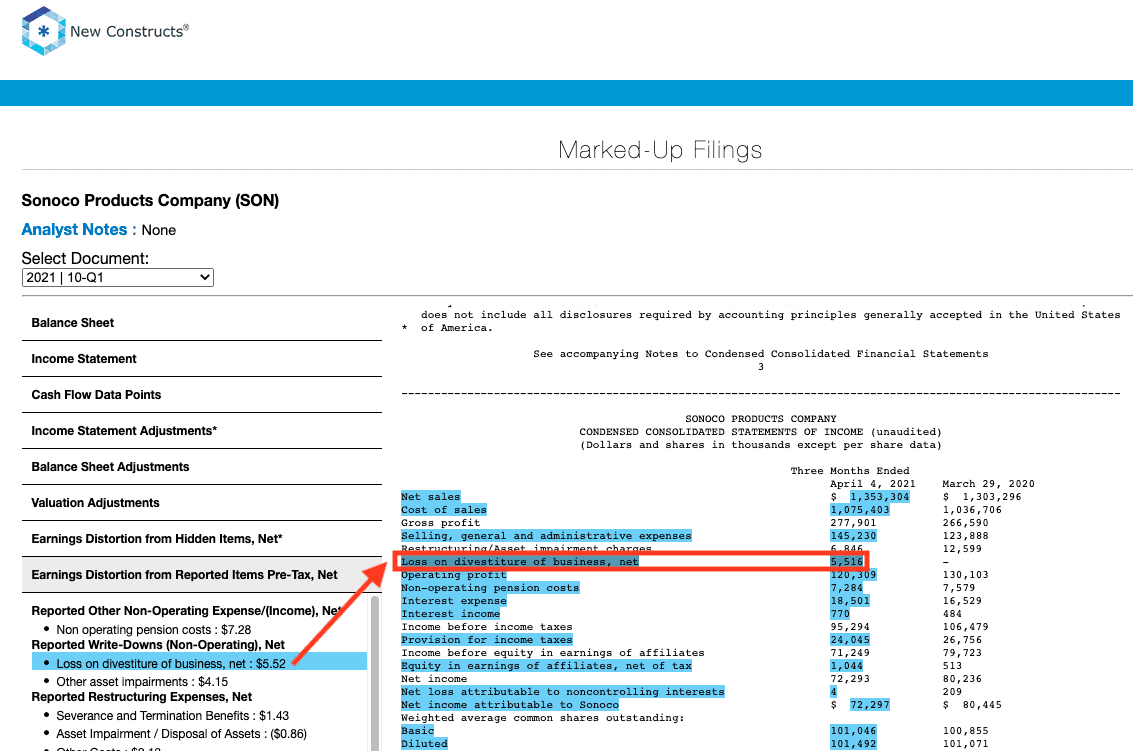
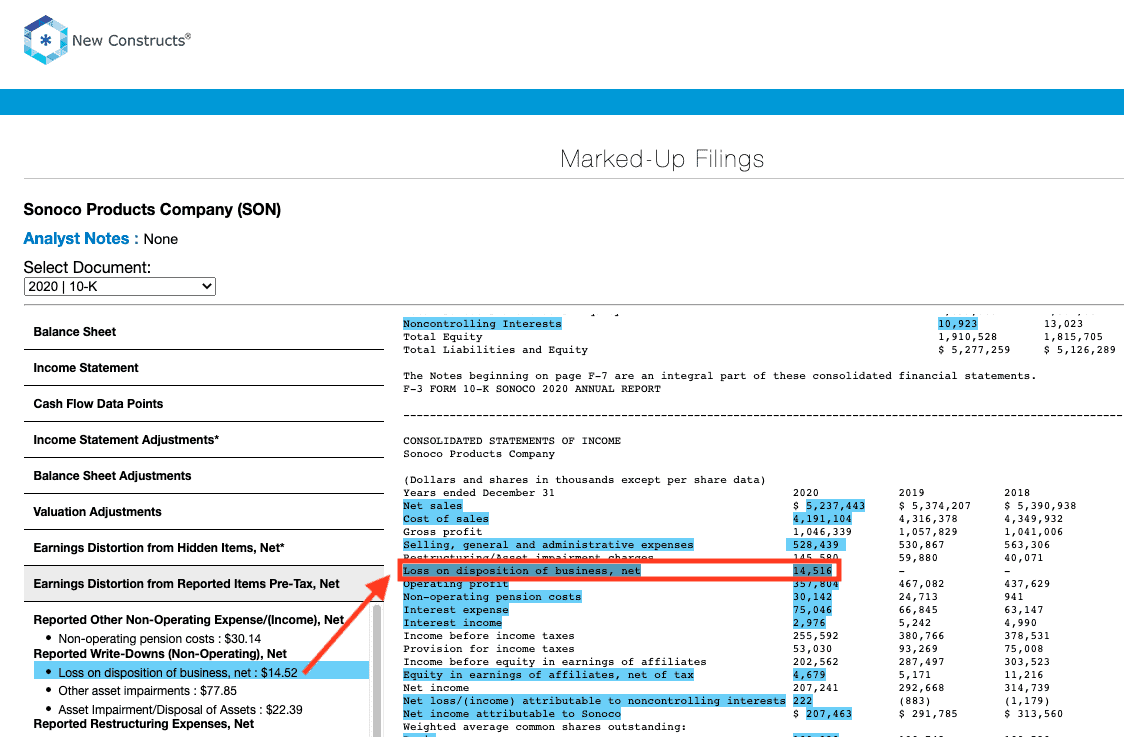
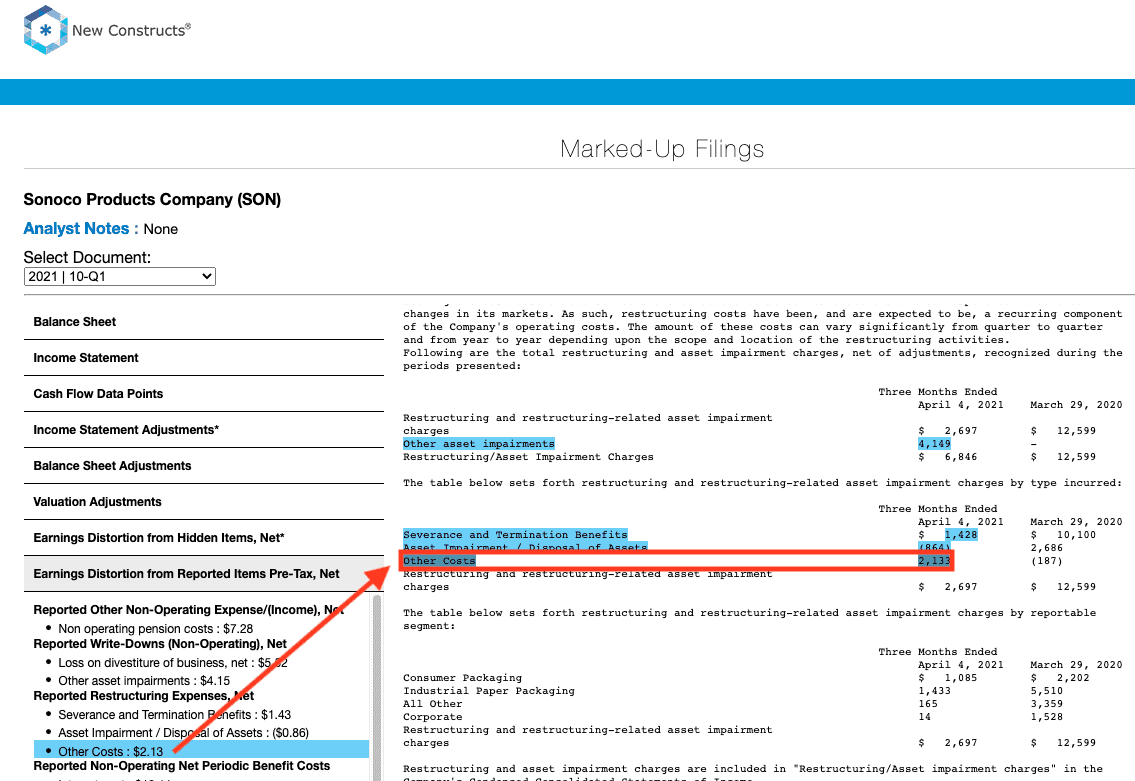
- -$6 million loss on divestiture of business in 1Q21
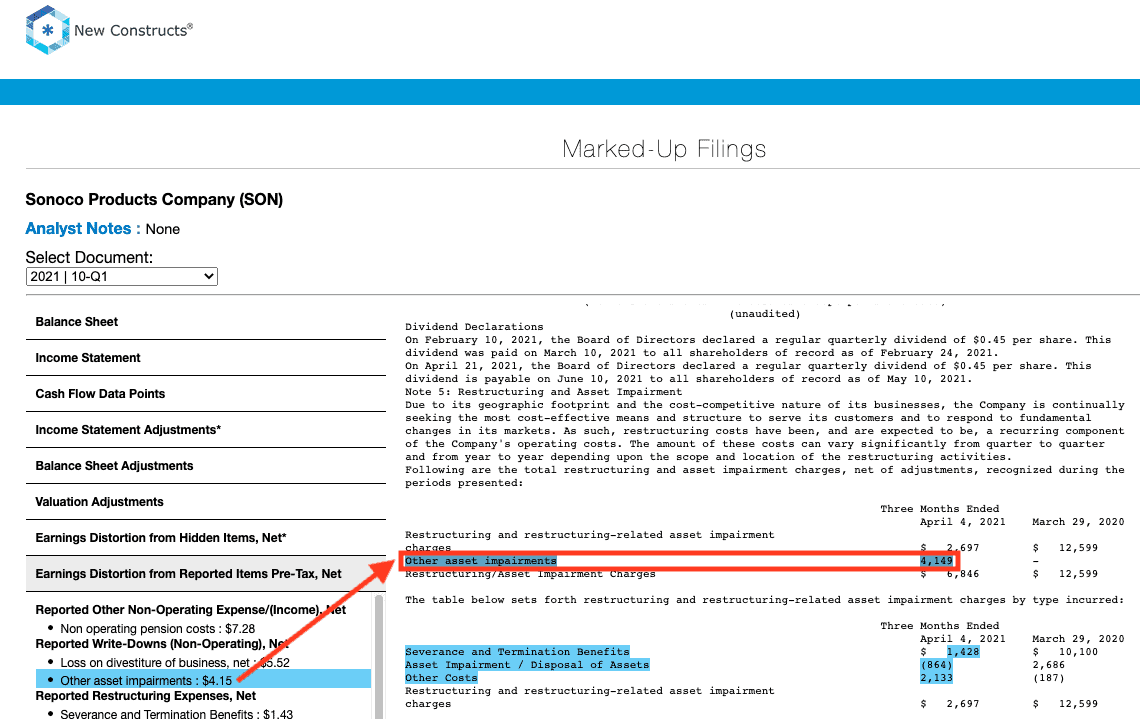
- -$4 million other asset impairments in 1Q21
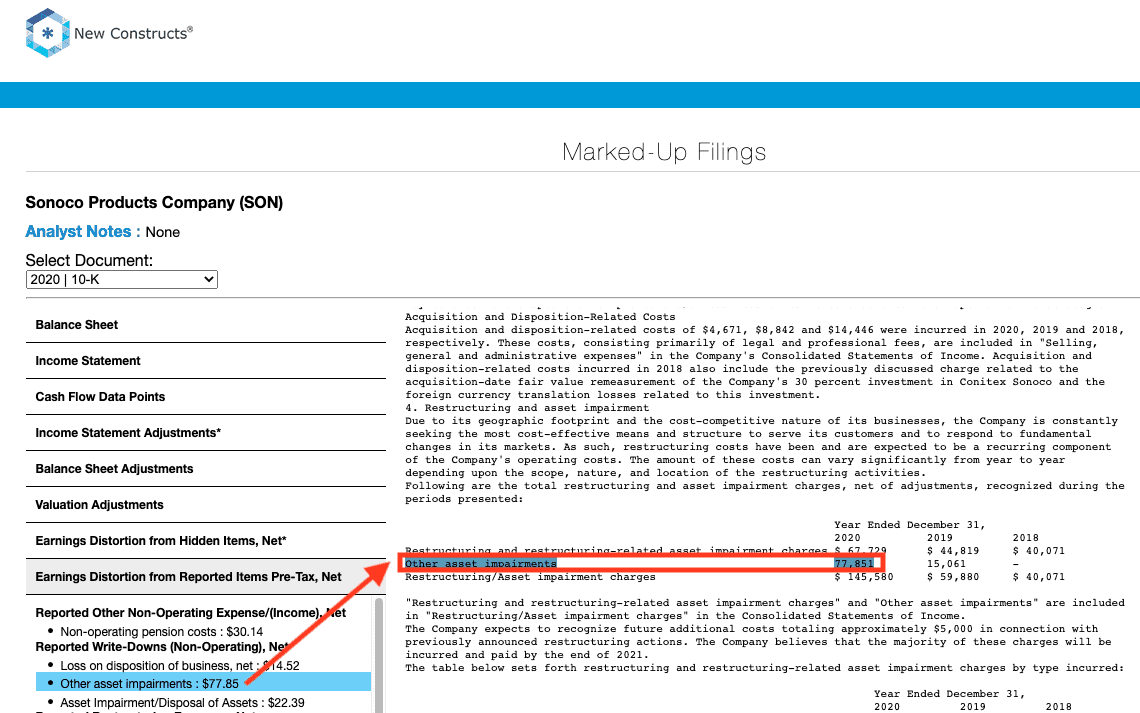
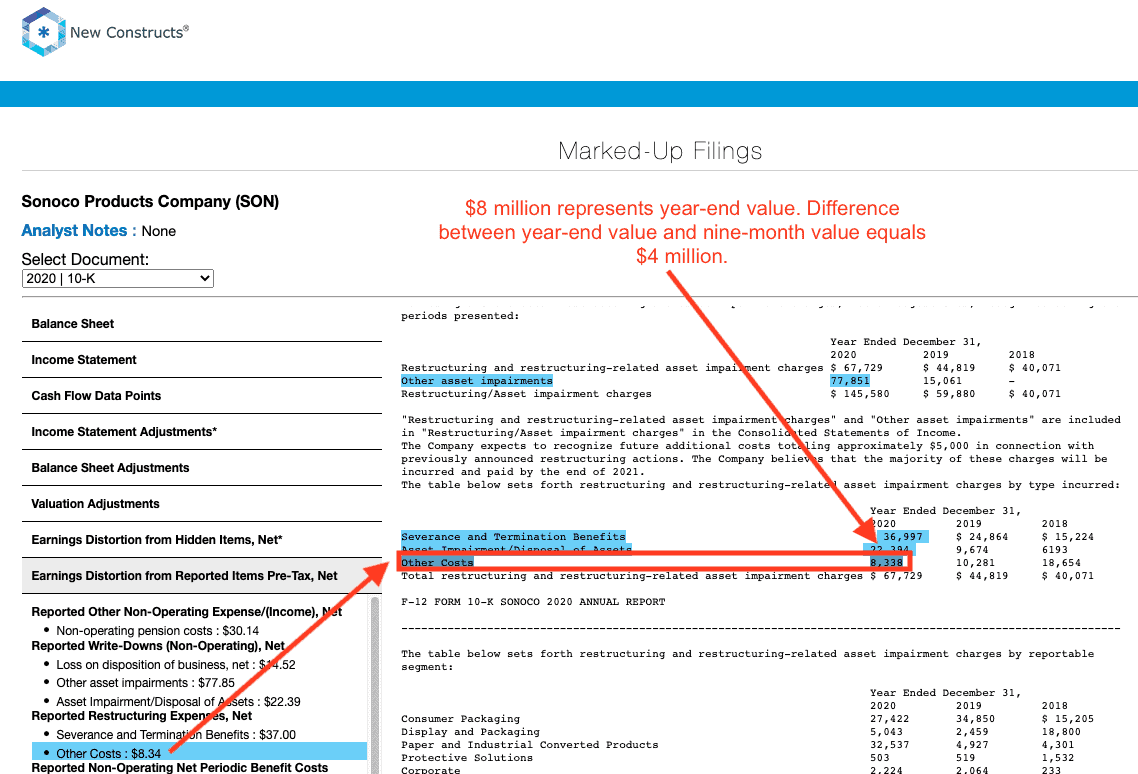
- -$78 million other asset impairments in 4Q20
- -$22 million asset impairment/disposal of assets in 4Q20
- -15 million loss on disposition of business in 4Q20
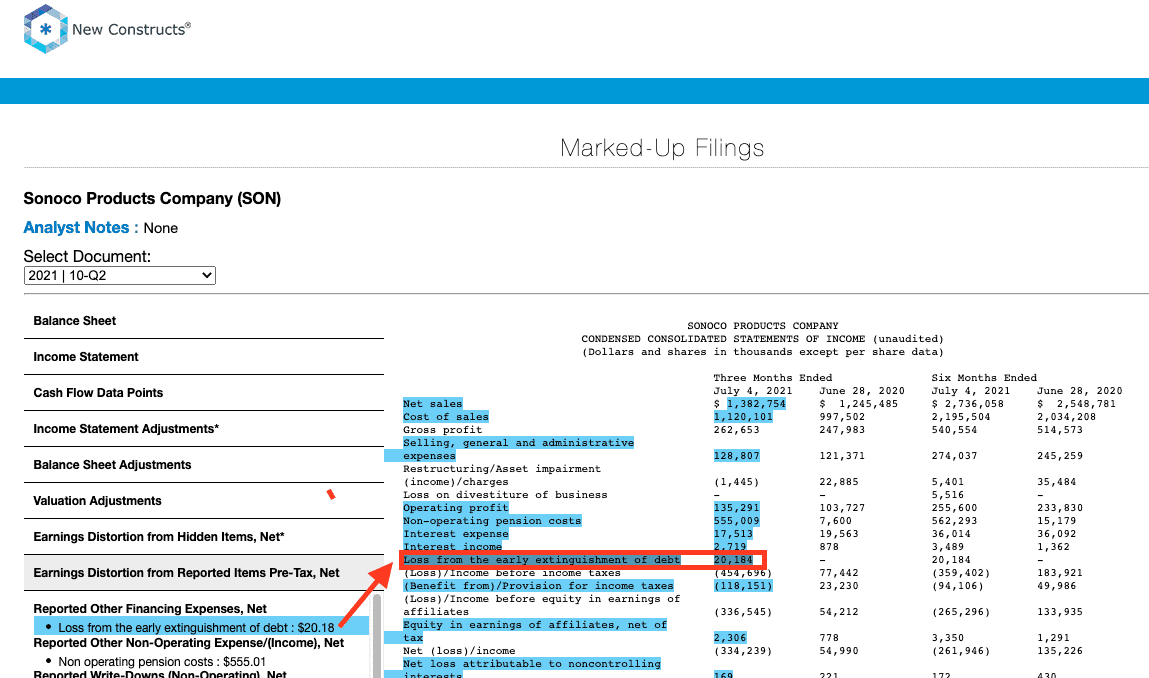
- -$20 million in losses from the early extinguishment of debt in 2Q21
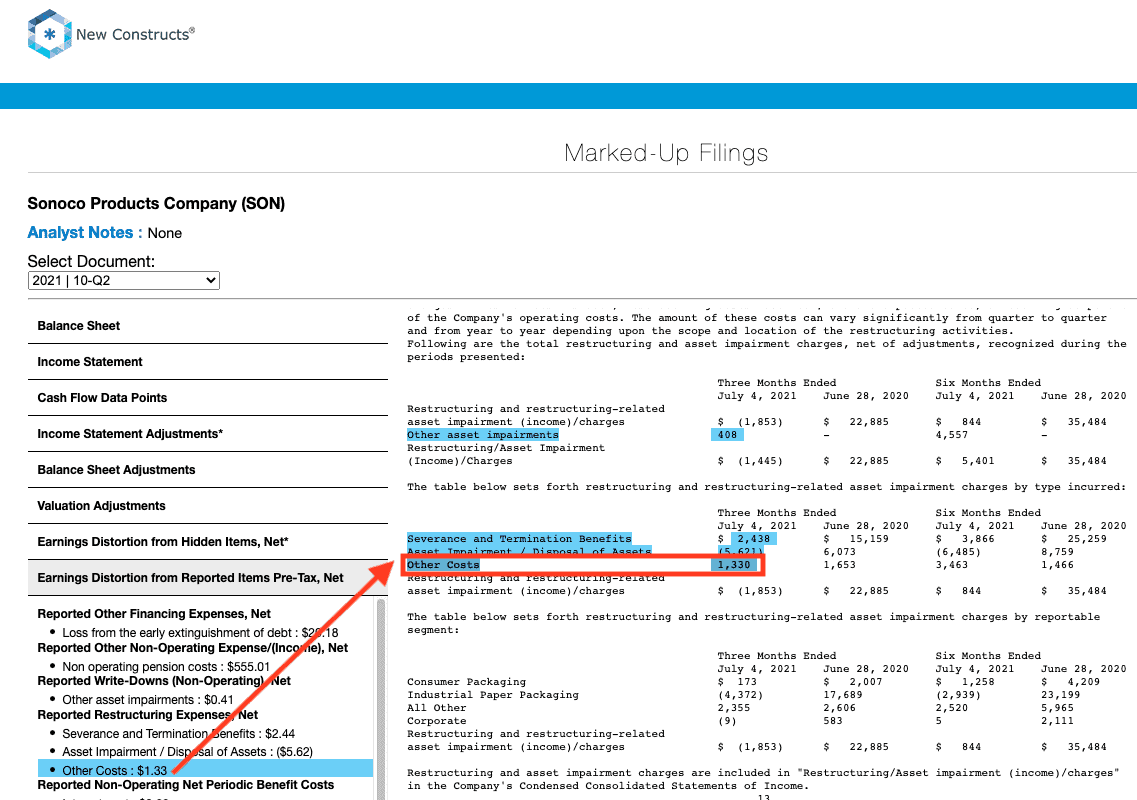
- -$11 million in reported restructuring expenses in the TTM period, based on
- $6 million disposal of assets in 2Q21
- $1 million disposal of assets in 1Q21
- $2 million in severance and termination benefits in 2Q21
- $1 million in severance and termination benefits in 1Q21
- $7 million in severance and termination benefits in 4Q20
- -$1 million in other costs in 2Q21
- -$2 million in other costs in 1Q21
- -$4 million in other costs in 4Q20
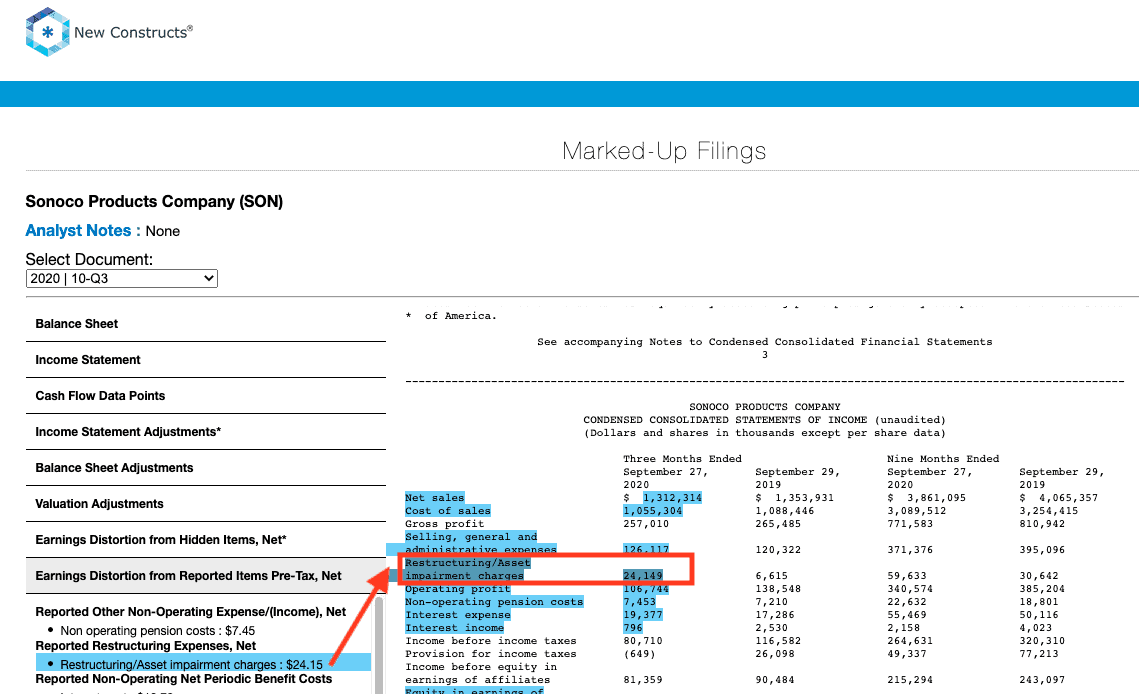
- -$24 million in restructuring/asset impairment charges in 3Q20
- $29 million contra adjustment for recurring pension costs. These recurring expenses are reported in non-recurring line items, so we add them back and exclude them from Earnings Distortion.
Tax Distortion = $209 million or 2.06/per share
- We remove the tax impact of unusual items on reported taxes when we calculate Core Earnings. It is important that taxes get adjusted so they are appropriate for adjusted pre-tax earnings.
This article originally published on September 1, 2021.
Disclosure: David Trainer, Kyle Guske II, Alex Sword and Matt Shuler receive no compensation to write about any specific stock, style, or theme.
Follow us on Twitter, Facebook, LinkedIn, and StockTwits for real-time alerts on all our research.
Appendix: Calculation Methodology
We derive the Core Earnings and GAAP Earnings metrics above by summing the Trailing Twelve Month individual NC 2000 constituent values for Core Earnings and GAAP Earnings in each sector for each measurement period. We call this approach the “Aggregate” methodology.
The Aggregate methodology provides a straightforward look at the entire sector, regardless of market cap or index weighting and matches how S&P Global (SPGI) calculates metrics for the S&P 500.
[1] Only Core Earnings enable investors to overcome the inaccuracies, omissions and biases in legacy fundamental data and research, as proven in Core Earnings: New Data & Evidence, written by professors at Harvard Business School (HBS) & MIT Sloan and published in The Journal of Financial Economics.
[2] The NC 2000 consists of the largest 2000 U.S. companies by market cap in our coverage. Constituents are updated on a quarterly basis (March 31, June 30, September 30, and December 31). We exclude companies that report under IFRS and non-U.S. ADR companies.
[3] Three independent studies prove the superiority of our data, models, and ratings. Learn more here.
[4] The full version of this report provides analysis for every sector like what we show for this sector.