
Within the NC 2000, all but three sectors, (Consumer Cyclicals, Industrials, and Energy) saw a year-over-year (YoY) rise in Core Earnings in 1Q21. The widespread improvement in Core Earnings is in stark contrast to last quarter, when just four sectors saw a YoY increase in Core Earnings. See Figure 1 for more details.
This report analyzes the Core Earnings[1] and GAAP earnings of the NC 2000[2], our All Cap Index, and each of its sectors. The most recent Core Earnings and GAAP earnings values are based on the latest audited financial data, which is the calendar 1Q21 10-Q for most companies.
Investors armed with our research enjoy a differentiated and more informed view of the fundamentals and valuations of companies and sectors.
Ranking the Sectors by Core Earnings Growth
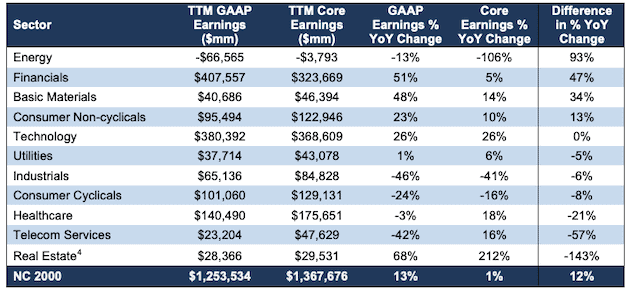
Figure 1 compares the year-over-year (“YoY”) change in Core Earnings and GAAP Earnings from 1Q20 to 1Q21[3] for all 11 NC 2000 sectors.
Figure 1: 1Q21 Core Earnings & GAAP Earnings % YoY Change
Sources: New Constructs, LLC and company filings.
Our Core Earnings analysis is based on aggregated TTM data for the sector constituents.
The Real Estate sector saw the largest % YoY improvement in Core Earnings, which rose from just $9.5 billion in 1Q20 to $29.5 billion in 1Q21.
The Technology sector generates the most Core Earnings (over 14% more than the next closest sector) and grew Core Earnings by 26% YoY in 1Q21. On the flip side, the Energy sector has the lowest Core Earnings and the largest YoY drop in 1Q21. Even though oil prices have recently begun to climb, the COVID-19 shutdowns across the globe hit the energy sector hardest over the past year.
The Energy sector, at 93%, had the most overstated YoY change in GAAP earnings for 1Q21, while the Real Estate sector, at 143%, had the most understated YoY change GAAP earnings for 1Q21.
Details on the NC 2000 & 11 Sectors
Figures 2-13 compare the Core Earnings and GAAP earnings trends for the NC 2000 and every NC 2000 sector since 4Q98.
Core Earnings Are Better than GAAP Earnings
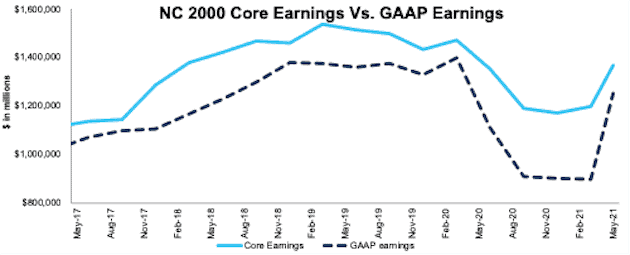
Figure 2 shows Core Earnings for the NC 2000 are a better and much less volatile measure of earnings than GAAP earnings. GAAP earnings fell 36% from 4Q19 to 4Q21 while Core Earnings fell 19%, or about half as much, over the same time. Depressed GAAP earnings throughout 2020, largely due to record write-downs, means companies are set up for record YoY comps and growth in 2021. Accordingly, investors should take the reported earnings growth in 2021 with a grain of salt.
For example, Core Earnings for the NC 2000 rose 1% YoY in 1Q21, far less than the 13% rise in GAAP earnings over the same time.
Figure 2 also highlights the severe impact of the COVID-19 pandemic, as Core and GAAP Earnings for the NC 2000 are remain well below 4Q17 levels.
Figure 2: NC 2000 Core Earnings Vs. GAAP: 1Q17 – 1Q21
Sources: New Constructs, LLC and company filings.
Our Core Earnings analysis is based on aggregated TTM data for the sector constituents in each measurement period.
The May 19, 2021 measurement period incorporates the financial data from 2021 10-Qs, as this is the earliest date for which all the 2021 10-Qs for the NC 2000 constituents were available.
Basic Materials
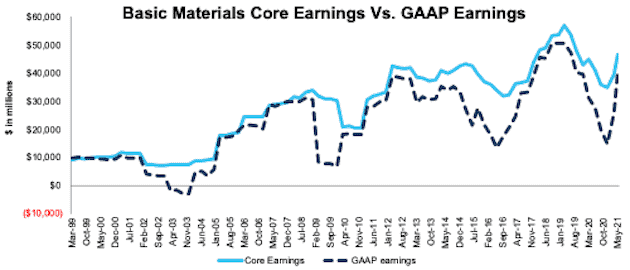
Figure 3 shows Core Earnings for the Basic Materials sector rose 14% YoY in 1Q21, while GAAP earnings rose 48% over the same time. After recording large asset write-downs in 1H20, which artificially reduced GAAP earnings, GAAP earnings exceeded pre-pandemic levels in 1Q21.
Figure 3: Basic Materials Core Earnings Vs. GAAP: 4Q98 – 1Q21
Sources: New Constructs, LLC and company filings.
Our Core Earnings analysis is based on aggregated TTM data for the sector constituents in each measurement period.
The May 19, 2021 measurement period incorporates the financial data from 2021 10-Qs, as this is the earliest date for which all the 2021 10-Qs for the NC 2000 constituents were available.
Consumer Cyclicals
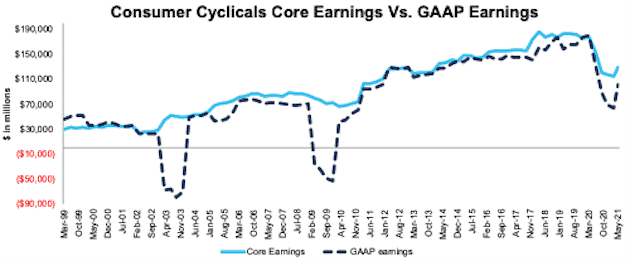
Figure 4 shows Core Earnings for the Consumer Cyclicals sector fell 14% YoY in 1Q21, while GAAP earnings fell 24% over the same time. Global shutdowns and depressed leisure spending caused the large drop in Core Earnings.
Figure 4: Consumer Cyclicals Core Earnings Vs. GAAP: 4Q98 – 1Q21
Sources: New Constructs, LLC and company filings.
Our Core Earnings analysis is based on aggregated TTM data for the sector constituents in each measurement period.
The May 19, 2021 measurement period incorporates the financial data from 2021 10-Qs, as this is the earliest date for which all the 2021 10-Qs for the NC 2000 constituents were available.
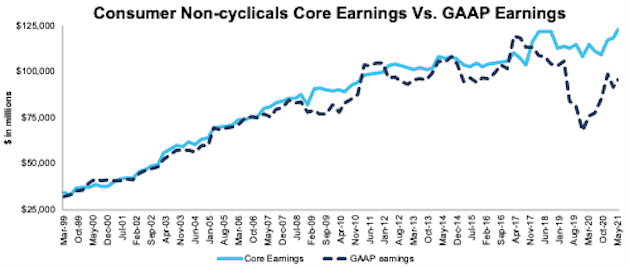
Consumer Non-Cyclicals
Figure 5 shows Core Earnings for the Consumer Non-cyclicals sector rose 10% YoY in 1Q21, while GAAP earnings rose 23% over the same time. The disconnect between Core Earnings and GAAP earnings is largely the result of Walmart (WMT) and McKesson (MCK). Walmart reported an $8.4 billion write-down related to disposal of business operations and disclosed $4 billion in incremental cost related to COVID-19 in the MD&A on page 35 of its fiscal 2021 10-K. McKesson (MCK) reported $7.9 billion in claims and litigation charges in its fiscal 2021 10-K. Our Core Earnings remove such unusual, non-operating charges, so investors get more accurate, and less volatile, views of profits.
Figure 5: Consumer Non-Cyclicals Core Earnings Vs. GAAP: 4Q98 – 1Q21
Sources: New Constructs, LLC and company filings.
Our Core Earnings analysis is based on aggregated TTM data for the sector constituents in each measurement period.
The May 19, 2021 measurement period incorporates the financial data from 1Q21 10-Qs, as this is the earliest date for which all the 1Q21 10-Qs for the NC 2000 constituents were available.
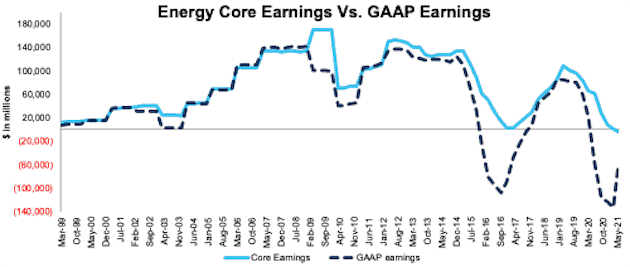
Energy
Figure 6 shows Core Earnings for the Energy sector fell 106% YoY in 1Q21, while GAAP earnings fell 13% over the same time.
Figure 6: Energy Core Earnings Vs. GAAP: 4Q98 – 1Q21
Sources: New Constructs, LLC and company filings.
Our Core Earnings analysis is based on aggregated TTM data for the sector constituents in each measurement period.
The May 19, 2021 measurement period incorporates the financial data from 2021 10-Qs, as this is the earliest date for which all the 2021 10-Qs for the NC 2000 constituents were available.
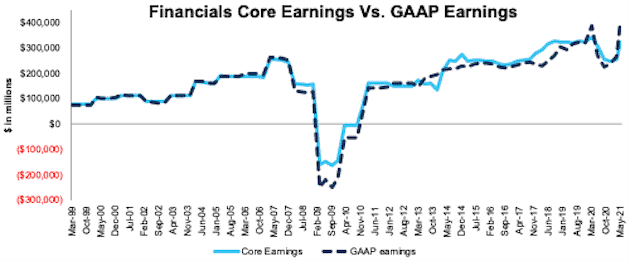
Financials
Figure 7 shows Core Earnings for the Financials sector rose 5% YoY in 1Q21, while GAAP earnings rose 51% over the same time. Overall, Core Earnings held up much better than during the Financial Crisis. The key difference between the two periods, as we noted in our Long Idea on JPMorgan Chase (JPM), is that many banks were the source of the problems that caused the Financial Crisis while playing a key role in the recovery during COVID-19.
Figure 7: Financials Core Earnings Vs. GAAP: 4Q98 – 1Q21
Sources: New Constructs, LLC and company filings.
Our Core Earnings analysis is based on aggregated TTM data for the sector constituents in each measurement period.
The May 19, 2021 measurement period incorporates the financial data from 2021 10-Qs, as this is the earliest date for which all the 2021 10-Qs for the NC 2000 constituents were available.
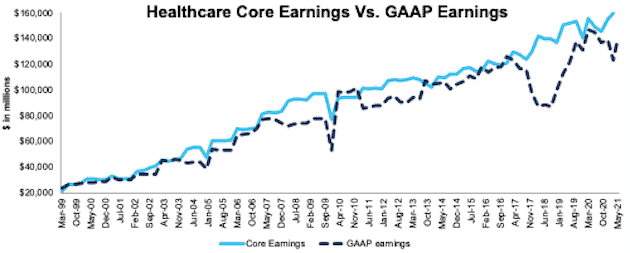
Healthcare
Figure 8 shows Core Earnings for the Healthcare sector rose 18% YoY in 1Q21, while GAAP earnings fell 3% over the same time. The consistent rise in demand for healthcare, after the initial drop in elective procedures during the onset of the COVID-19 pandemic, helps drive continued Core Earnings growth.
Figure 8: Healthcare Core Earnings Vs. GAAP: 4Q98 – 1Q21
Sources: New Constructs, LLC and company filings.
Our Core Earnings analysis is based on aggregated TTM data for the sector constituents in each measurement period.
The May 19, 2021 measurement period incorporates the financial data from 2021 10-Qs, as this is the earliest date for which all the 2021 10-Qs for the NC 2000 constituents were available.
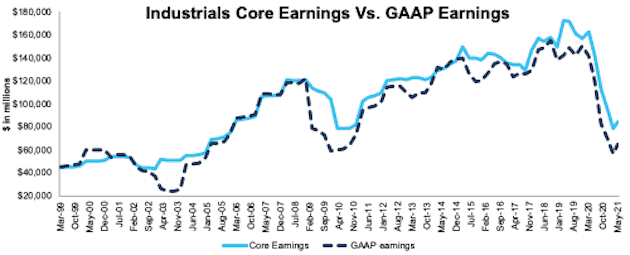
Industrials
Figure 9 shows Core Earnings for the Industrials sector fell 41% YoY in 1Q21, while GAAP earnings fell 46% over the same time. Not surprisingly, the Industrials sector, which is most exposed to the drastic drop in airline travel and reduced capex across the globe, bore much of the brunt of the global shut downs.
Figure 9: Industrials Core Earnings Vs. GAAP: 4Q98 – 1Q21
Sources: New Constructs, LLC and company filings.
Our Core Earnings analysis is based on aggregated TTM data for the sector constituents in each measurement period.
The May 19, 2021 measurement period incorporates the financial data from 2021 10-Qs, as this is the earliest date for which all the 2021 10-Qs for the NC 2000 constituents were available.
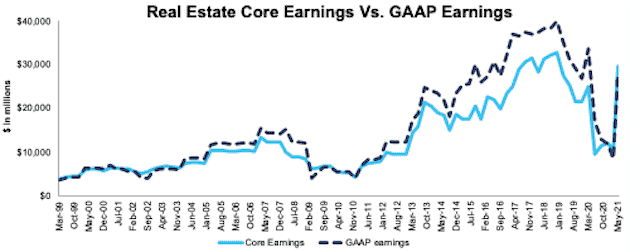
Real Estate
Figure 10 shows Core Earnings for the Real Estate sector rose 212% YoY in 1Q21, while GAAP earnings rose 68% over the same time.
Figure 10: Real Estate Core Earnings Vs. GAAP: 4Q98 – 1Q21
Sources: New Constructs, LLC and company filings.
Our Core Earnings analysis is based on aggregated TTM data for the sector constituents in each measurement period.
The May 19, 2021 measurement period incorporates the financial data from 2021 10-Qs, as this is the earliest date for which all the 2021 10-Qs for the NC 2000 constituents were available.
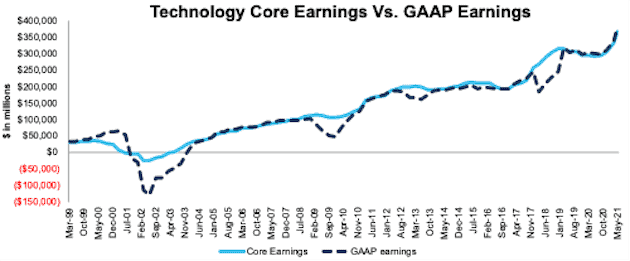
Technology
Figure 11 shows Core Earnings for the Technology sector rose 26% YoY in 1Q21, while GAAP earnings rose 26% over the same time as well. Our analysis of the NC 2000 and S&P 500 Technology sector further illustrates the “Fool’s Gold” nature of the sector. For example, the 77 stocks in the S&P 500 Technology sector generated $363 billion in TTM Core Earnings as of 1Q21, while the 314 stocks in the NC 2000 Technology sector generated $369 billion in TTM Core Earnings as of 1Q21.
Figure 11: Technology Core Earnings Vs. GAAP: 4Q98 – 1Q21
Sources: New Constructs, LLC and company filings.
Our Core Earnings analysis is based on aggregated TTM data for the sector constituents in each measurement period.
The May 19, 2021 measurement period incorporates the financial data from 2021 10-Qs, as this is the earliest date for which all the 2021 10-Qs for the NC 2000 constituents were available.
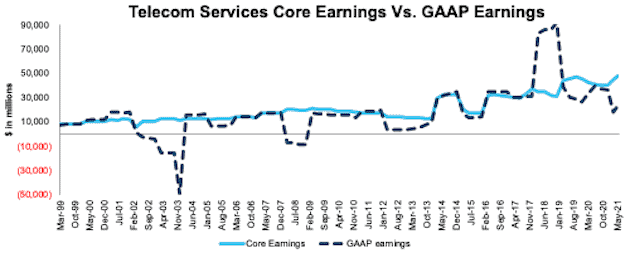
Telecom Services
Figure 12 shows Core Earnings for the Telecom Services sector rose 16% YoY in 1Q21, while GAAP earnings fell 42% over the same time. This disconnect between Core Earnings and GAAP earnings beginning in 2Q20 is driven largely by AT&T (T)’s $15.5 billion write-down of assets and goodwill related to its video business. In total, AT&T’s asset write-downs equaled 33% of the sector’s Core Earnings in 1Q21.
The significant jump in GAAP earnings in 2018 come from the Tax Cuts and Jobs Act. At the time, we identified Verizon (VZ) and AT&T (T) as the biggest winners of tax reform, and in 2017, they recorded nearly $25 billion in combined income tax benefits. Note how our Core Earnings adjusts for the anomalous, one-time tax effects.
Figure 12: Telecom Services Core Earnings Vs. GAAP: 4Q98 – 1Q21
Sources: New Constructs, LLC and company filings.
Our Core Earnings analysis is based on aggregated TTM data for the sector constituents in each measurement period.
The May 19, 2021 measurement period incorporates the financial data from 2021 10-Qs, as this is the earliest date for which all the 2021 10-Qs for the NC 2000 constituents were available.
Utilities
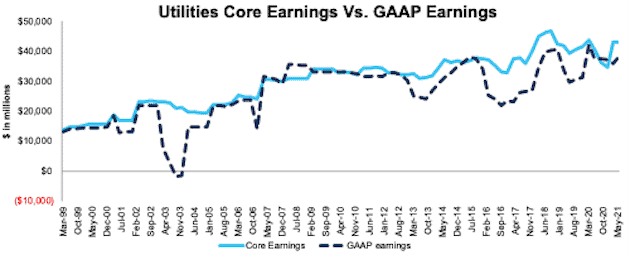
Figure 13 shows Core Earnings for the Utilities sector rose 6% YoY in 1Q21, while GAAP earnings rose 1% over the same time.
Figure 13: Utilities Core Earnings Vs. GAAP: 4Q98 – 1Q21
Sources: New Constructs, LLC and company filings.
Our Core Earnings analysis is based on aggregated TTM data for the sector constituents in each measurement period.
The May 19, 2021 measurement period incorporates the financial data from 2021 10-Qs, as this is the earliest date for which all the 2021 10-Qs for the NC 2000 constituents were available.
This article originally published on June 7, 2021.
Disclosure: David Trainer, Kyle Guske II, and Matt Shuler receive no compensation to write about any specific stock, style, or theme.
Follow us on Twitter, Facebook, LinkedIn, and StockTwits for real-time alerts on all our research.
Appendix: Calculation Methodology
We derive the Core Earnings and GAAP Earnings metrics above by summing the Trailing Twelve Month individual NC 2000 constituent values for Core Earnings and GAAP Earnings in each sector for each measurement period. We call this approach the “Aggregate” methodology.
The Aggregate methodology provides a straightforward look at the entire sector, regardless of market cap or index weighting and matches how S&P Global (SPGI) calculates metrics for the S&P 500.
[1] Only Core Earnings enable investors to overcome the inaccuracies, omissions and biases in legacy fundamental data and research, as proven in Core Earnings: New Data & Evidence, written by professors at Harvard Business School (HBS) & MIT Sloan and forthcoming in The Journal of Financial Economics.
[2] The NC 2000 consists of the largest 2000 U.S. companies by market cap in our coverage. Constituents are updated on a quarterly basis (March 31, June 30, September 30, and December 31). We exclude companies that report under IFRS and non-U.S. ADR companies.
[3] May 19, 2021 is earliest date for which all the 2021 10-Qs for the NC 2000 constituents were available.
[4] We use GAAP earnings for this analysis instead of Funds From Operations (FFO), the value we use in other comparisons and our stock ratings.