
We’ve long warned about the hidden dangers of passive investing, namely that it is overcrowded, doesn’t efficiently allocate capital, and drives already expensive stocks to even more overvalued levels. Despite the risks, passive investing now makes up the majority of assets under management.
Unfortunately, the “solution” to the rising risks in passive investing is not to simply “do the opposite” or allocate to actively managed funds because:
- Active funds, particularly large and mid-cap, have underperformed their respective benchmarks for decades.
- Active funds are often more expensive than their passive counterparts, which makes outperformance even more difficult.
- Smaller active asset managers cannot compete effectively due to their smaller asset bases and poor fund offerings.
Investors deserve better.
We hate to see it, but the numbers show that, year in and year out, too many investors pile money into funds with poor holdings. There is a better way for investors… more on that later.
First, to this week’s Danger Zone pick: mediocre asset managers. In particular, we’re featuring an Unattractive rated asset manager, Virtus Investment Partners (VRTS) below.
Not only is this asset manager dwarfed by larger players in the industry, but its fund offerings aren’t as good, its margins lag peers, and its stock price looks increasingly overvalued.
Low Quality Fund Holdings in a Crowded Industry
Generally, asset management firms generate revenue through fees on the assets under management. Through the first six months of 2025, these investment management fees made up 85% of Virtus Investment Partners’ total revenue. To grow fee revenue, asset managers focus primarily on growing assets under management (“AUM”). Unfortunately, if they don’t offer quality funds, they will struggle to grow AUM.
We leverage our fund research, which analyzes the holdings of funds, to assess the quality of Virtus Investment Partners’ fund offerings. Unfortunately, the company’s mutual funds are lower quality than its larger competitors. Per Figure 1, more of its funds earn Unattractive-or-worse ratings and fewer get Attractive-or-better ratings vs. competitors such as Invesco (IVZ), BlackRock (BLK), and Franklin Resources (BEN).
Figure 1: Virtus Investment Partners Offers More Lower-Rated Funds
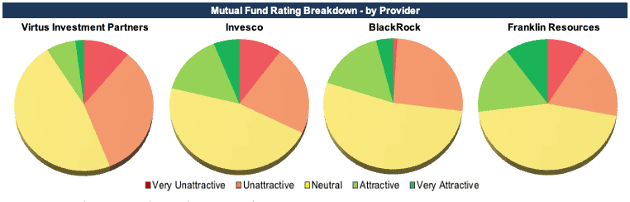
Sources: New Constructs, LLC, company filings, and fund filings.
Our AI Agent for investing allows us to analyze the holdings of all 103 Virtus Investment Partners mutual funds under coverage (along with its competitors) to provide a forward-looking investment rating on each one.
Per Figure 2, we find that 92% of Virtus Investment Partners’ mutual funds earn a Neutral-or-worse rating. As a benchmark reference point, 75% of all 6,200+ mutual funds under coverage earn a Neutral-or-worse rating.
Meanwhile, 73%, 78%, and 80% of Franklin Resources (BEN), Invesco (IVZ), and BlackRock (BLK) mutual funds earn a Neutral-or-worse rating, respectively.
On the worst end, 45% of Virtus Investment Partners’ mutual funds earn an Unattractive-or-worse rating. 28%, 32%, and 27% of Franklin Resources, Invesco, and BlackRock mutual funds earn an Unattractive-or-worse rating, respectively.
On the flip side, just 9% of Virtus Investment Partners’ mutual funds earn an Attractive-or-better rating compared to 27%, 22%, and 20% for Franklin Resources, Invesco, and BlackRock mutual funds, respectively.
Figure 2: Virtus Investment Partners & Competitors’ Fund Rating Breakdown
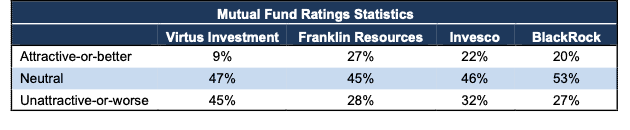
Sources: New Constructs, LLC and company filings.
Virtus Funds Are More Expensive as Well
On the cost side, Virtus Investment Partners’ mutual funds have an average total annual cost of 2.0% compared to 1.6% for our entire coverage universe of 6,200+ mutual funds. Virtus Investment Partners’ funds have higher average total annual costs than the funds provided by all three of the competitors listed in Figure 3 as well.
For reference, the average total annual cost of Franklin Resources, Invesco, and BlackRock funds is 1.7%, 1.6%, and 1.6%, respectively.
Low-quality holdings and higher costs make Virtus Investment Partners’ mutual funds more unattractive to investors than the average fund. Given the analysis above, it should come as no surprise that Virtus Investment Partners reported year-over-year (YoY) net outflows in 2023, 2024, and the first six months of 2025.
Profitability Lags Competitors
Not only does Virtus Investment Partners offer more Unattractive-rated funds than peers, but its profitability lags as well.
Per Figure 3, Virtus Investment Partners’ invested capital turns are the second worst and its return on invested capital (ROIC) is the third worst among asset management firms, which include Federated Hermes (FHI), T. Rowe Price Group (TROW), BlackRock (BLK), Franklin Resources (BEN), and more.
Virtus Investment Partners, as a smaller player with lower profitability, faces an uphill battle to grow in such a competitive landscape. With such a large portion of revenue reliant on fees, the company has less ability to lower fees to attract assets and remain profitable, yet needs to grow assets to justify the expectations in its stock price, as we’ll show below.
Figure 3: Virtus Investment Partners Profitability Vs. Competitors: TTM
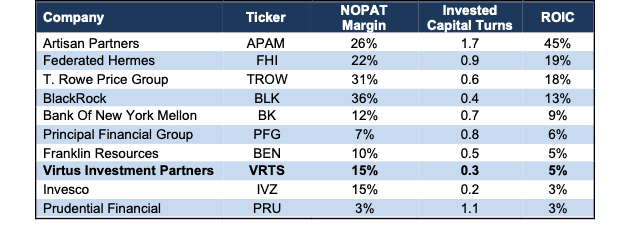
Sources: New Constructs, LLC and company filings.
Valuation Implies Massive Profit Growth
Below, we use our reverse discounted cash flow (DCF) model to analyze the future cash flow expectations baked into Virtus Investment Partners’ stock price. We also present an additional DCF scenario to highlight the downside risk in the stock if Virtus Investment Partners fails to achieve these overly optimistic expectations.
To justify its current price of $190/share, our model shows that Virtus Investment Partners would have to:
- immediately achieve a 19% NOPAT margin (above its TTM NOPAT margin of 15% and five-year average margin of 17%) and
- grow revenue 4% (above consensus estimates for 2025 (-4%), 2026 (1%), and 2027 (-2%)) compounded annually through 2034.
In this scenario, Virtus Investment Partners would generate $248 million in NOPAT in 2034, which is nearly double the company’s TTM NOPAT of $134 million and just below the company’s highest ever NOPAT of $252 million in 2021. This scenario also implies that the company would generate $1.3 billion in revenue, which would equal 1.5x its TTM revenue. Contact us for the math behind this reverse DCF scenario.
For reference, Virtus investment Partners has only achieved a 19% or higher NOPAT margin twice, in 2014 and 2021, since 2009.
50%+ Downside at Consensus Growth Rates
If we instead assume Virtus Investment Partners:
- immediately improves NOPAT margin to 17% (above TTM NOPAT margin of 15% and equal to five-year average margin) and
- revenue grows at consensus rates in 2025 (-4%), 2026 (1%), and 2027 (-2%), and
- revenue grows 4% each year thereafter through 2034, then
the stock would be worth $91/share today – a 52% downside to the current price. In this scenario, Virtus Investment Partners’ NOPAT would equal $198 million in 2034, which is 1.5x its TTM NOPAT. Contact us for the math behind this reverse DCF scenario.
For reference, Virtus Investment Partners’ NOPAT has fluctuated in recent years, and TTM NOPAT is 9% below 2022 and 47% below 2021.
Figure 4 compares Virtus Investment Partners’ implied future NOPAT in these scenarios to its historical NOPAT.
Figure 4: Virtus Investment Partners’ Historical and Implied NOPAT: DCF Valuation Scenarios
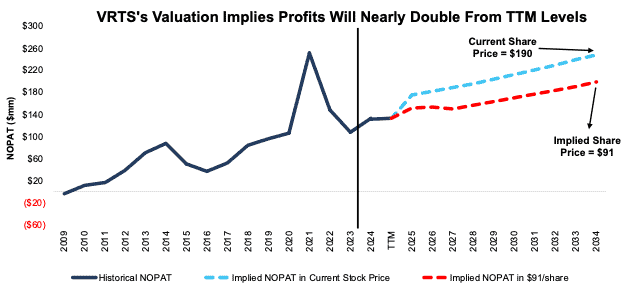
Sources: New Constructs, LLC and company filings.
Economic Book Value Implies Even More Downside
Each of the above scenarios assumes Virtus Investment Partners grows revenue, NOPAT and FCF without increasing working capital or fixed assets. This assumption is highly unlikely but allows us to create best-case scenarios that highlight the unrealistically high expectations embedded in the current valuation. For reference, Virtus Investment Partners’ invested capital grew 24% compounded annually over the last decade. If we assume the company’s invested capital increases at a similar rate in the DCF scenarios above, the downside risk is even larger.
Given that the performance required to justify its current price is optimistic, we dig deeper to see if Virtus Investment Partners is worth buying at any price.
The company has $2.3 billion in total debt, $123 million in minority interests, and just $201 million excess cash. As a result, Virtus Investment Partners has an economic book value, or no-growth value, of -$27/share.
Virtus Investment Partners Isn’t Alone
While we featured Virtus Investment Partners above as an example of a traditional asset manager that offers low-quality funds and has poor fundamentals, itself, the company is not alone.
In fact, 75% of the 52 Investment Management and Fund Operators under coverage earn a Neutral-or-worse Stock Rating. 40% of the companies earn an Unattractive-or-worse Stock Rating.
In other words, the industry is filled with companies which have low profitability and expensive stock prices.
With improvements in technology, investors are no longer beholden to traditional asset managers and can enjoy the best of both worlds: low fees and superior stock picking.
There Is a Better Way: Get Superior and Easier Fund Management
Clearly, there are not many good investment companies out there.
ETF and mutual funds are charging you a fee for a service that adds little value and that you can easily perform on your own. Why pay fees to these firms when they do not provide good funds to invest in?
Our Do-It-Yourself ETF Tool
We think the days of paying fees for ETF issuers or mutual fund managers to pick stocks are near the end because:
- investors do not get any value for the fees they pay, and
- new technology makes it easy for investors to build their own ETF, without fees and based on proven superior research.
This idea isn’t hypothetical. Pro and Institutional members already have access to this technology on the Portfolios page. We call it the DIY ETF. See Figure 5.
The DIY ETF tool gives clients the ability to create a custom basket of stocks, ETFs and/or mutual funds and weight them according to our alpha-generating data and metrics.
Figure 5: New Constructs DIY ETF Tool
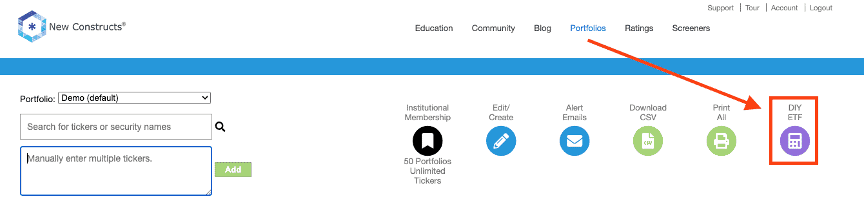
Sources: New Constructs, LLC and company filings.
Once clients have finalized the stocks they want in their fund and how they want to weight the stocks, they can, with one click, download a standard order form for any broker to buy the stocks to create their custom fund.
Figure 2 shows where to access key features on the DIY ETF page:
- Enter any investment amount – our system automatically adjusts your order form for the amount of money you wish to allocate.
- Choose the weighting methodology – we offer 10+ metrics, including market cap, dividend yield, our proprietary Core Earnings or return on invested capital (ROIC), and your own custom weightings.
- Download Order Form – get a CSV file with every order needed to create the portfolio on the page. Click here for a sample.
Figure 6: How to Use the DIY ETF Tool
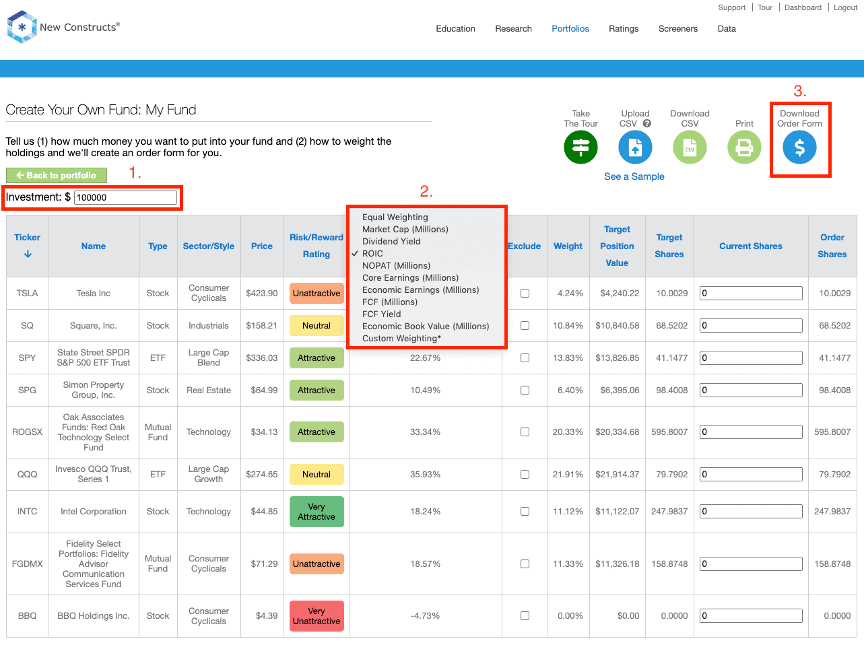
Sources: New Constructs, LLC and company filings.
Why DIY ETF?
Why would investors want to create their own ETF? Outperformance, of course.
When it comes to outperformance, we can deliver, and we can prove that we can deliver.
Three live-traded indices based on our Stock Ratings and Core Earnings research have outperformed the S&P 500 in 1H25 and over the past 5 years. These indices are provided by Bloomberg’s Index Licensing Group. Below are details on how you can look them up and see the outperformance for yourself.
Is there a better way to prove the alpha in our research than live, actively traded indices that beat the market?
- Bloomberg New Constructs Core Earnings Leaders Index (ticker: BCORET:IND)
- Bloomberg New Constructs Ratings VA-1 Index (ticker: BNCVA1T:IND)
- Bloomberg New Constructs 500 Index (ticker: B500NCT:IND)
The Bloomberg New Constructs Core Earnings Leaders Index, which allocates based on Earnings Capture and Core Earnings, beat the S&P 500 by over 36% over the past five years. The Index (ticker: BCORET:IND) was up 125% while the S&P 500 was up 89%.
Figure 7: Bloomberg New Constructs Core Earnings Leaders Index Outperforms S&P 500: Last 5 Years
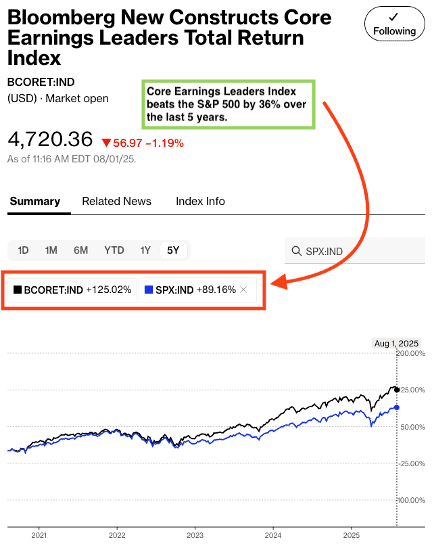
Sources: Bloomberg as of August 1, 2025
Note: Past performance is no guarantee of future results.
The “Very Attractive Stocks” Index, which allocates to stocks that get a Very Attractive rating by our AI Agent for Investing, beat the S&P 500 by 66% over the last five years. Bloomberg’s official name for the index is Bloomberg New Constructs Ratings VA-1Index (ticker: BNCVAT1T:IND). Figure 8 shows it was up 155% while the S&P 500 was up 89%.
Figure 8: Very Attractive-Rated Stocks Strongly Outperform the S&P 500: Last Five Years
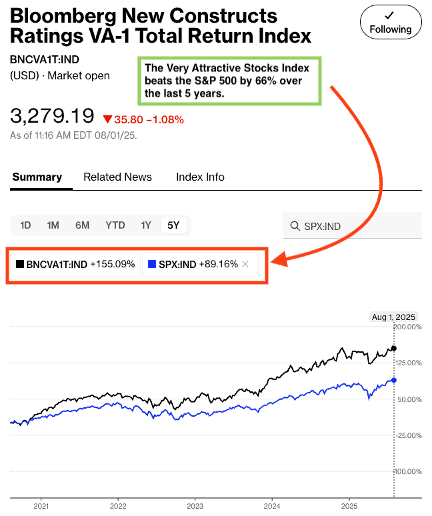
Sources: Bloomberg as of August 1, 2025
Note: Past performance is no guarantee of future results.
Our “Core-Earnings Weighted S&P 500” Index, which weights the largest 500 U.S. companies by Core Earnings instead of market cap, beat the S&P 500 by 27% over the past five years. Bloomberg’s official name for the index is Bloomberg New Constructs 500 Total Return Index (ticker: B500NCT:IND). Figure 9 shows it was up 117% while the S&P 500 was up 89%.
Figure 9: Bloomberg New Constructs 500 Index Strongly Outperforms the S&P 500: Last Five Years
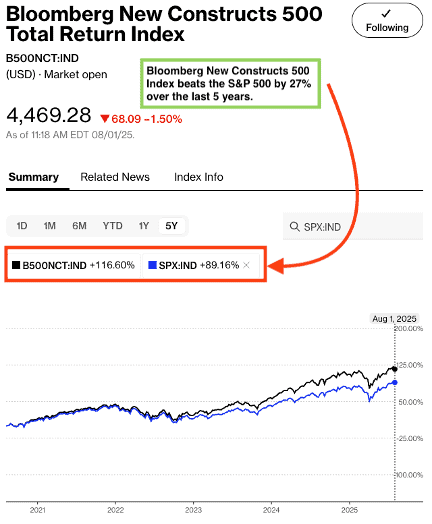
Sources: Bloomberg as of August 1, 2025
Note: Past performance is no guarantee of future results.
This article was originally published on August 11, 2025.
Disclosure: David Trainer, Kyle Guske II, and Hakan Salt receive no compensation to write about any specific stock, sector, style, or theme.
Questions on this report or others? Join our online community and connect with us directly.