
We closed this position on December 10, 2019. A copy of the associated Position Update report is here.
Check out this week’s Danger Zone interview with Chuck Jaffe of Money Life.
New research from Harvard Business School and MIT Sloan uses our novel database of footnotes disclosures to show earnings for the S&P 500 are distorted by an average of 22%.
The market doesn’t understand this earnings distortion because investors are not fully digesting footnotes. And honestly, who can blame them – who has time to read filings that can be 200+ pages long? That’s why we have spent the last 19 years training our machine learning engine to read SEC filings and pull out thousands of datapoints. Using our proprietary footnotes database, we created an Earnings Distortion Scorecard[1] to show how much unusual gains/losses distort Street earnings and find companies with significantly over/understated earnings.
This week’s Danger Zone pick gets a poor Earnings Distortion Score and has an expensive valuation. We think this stock more likely to miss earnings expectations in the short-term and underperform the market in the long-term. Investors should avoid or sell this stock ahead of its fiscal 4Q19 earnings report on November 25, 2019. Jacobs Engineering Group (JEC: $97/share) is in the Danger Zone.
A Stock with Overstated TTM Earnings
Over the past decade, JEC’s reported earnings have typically understated the firm’s true profitability. Importantly, however, over the TTM period, JEC’s reported earnings have hit an inflection and now significantly overstate the firm’s true profitability, in large part due to unusual gains hidden in the footnotes and reported directly on the income statement. Figure 1 provides a historical look at the magnitude of earnings distortion in JEC’s GAAP earnings, as well as the drastic reversal over the TTM period.
Figure 1: JEC Earnings Distortion – TTM Significantly Overstated
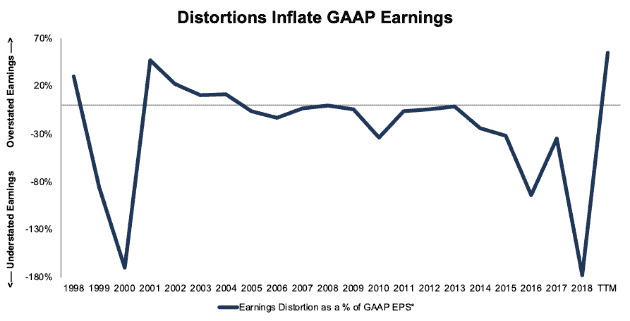
Sources: New Constructs, LLC and company filings
*The formula for Earnings Distortion as a % of GAAP EPS uses the absolute value of GAAP EPS.
As earnings distortion from unusual income increases, so does the level of earnings overstatement, both from GAAP net income and from street earnings, which the HBS & MIT Sloan paper shows do not capture most unusual items.
Without the aid of these unusual items, the likelihood that JEC misses earnings expectations when it reports fiscal 4Q19 earnings increases because the real fundamentals of the business are not as strong as reported earnings suggest.
Why is earnings data wrong and why is NC data the most accurate out there?
In “Core Earnings: New Data and Evidence,” Ethan Rouen and Charles Wang from HBS and Eric So from MIT Sloan show that corporate managers use non-operating and less persistent income-statement items to manipulate earnings.
“Street earnings for firms that meet or just beat analyst expectations are more likely to selectively exclude these items [non-operating and less persistent income-statement items].” – Abstract
Furthermore, the authors show that only New Constructs research includes the footnotes data needed to get the truth about earnings. Traditional data providers and analysts are missing or mis-categorizing a very material and growing amount of unusual gains/losses.
“…many of the …{unusual gains/losses} collected by New Constructs do not appear to be easily identifiable in Compustat…” – page 14
In other words, companies manipulate earnings and the market is inefficiently assessing earnings because too few people read financial footnotes. These footnotes contain important information that is required to measure reported and core earnings accurately. Only New Constructs accurately processes these footnote disclosures.
Breaking Down JEC’s Earnings Distortion
Over the TTM period, JEC had $368 million in net earnings distortion that cause earnings to be overstated. Notable unusual gains include:
- $435 million in earnings from discontinued operations – Page 32 3Q19 10-Q
- $37 million in miscellaneous income – Page 5 2Q19 10-Q
- $19 million in miscellaneous income – Page 5 3Q19 10-Q
Miscellaneous income in recent quarters includes items such as settlement gains on CH2M retiree medical plans, foreign currency gains, and transition services agreement related income associated with the sale of the Energy, Chemicals, and Resources business.
In total, we identified $2.61/share in net unusual income in JEC’s TTM results. After removing this earnings distortion from GAAP net income, we see that JEC’s TTM earnings of $2.12/share are significantly lower than $4.73/share in reported earnings.
ICING ON THE CAKE: Auditors Warning
In addition to overstated earnings in the TTM period, another red flag lingers over JEC. JEC’s auditor, Ernst & Young, noted in the firm’s 2018 10-K that “Jacobs Engineering Group Inc. and subsidiaries (the Company) has not maintained effective control over financial reporting.” This opinion was given due to the fact that management “identified a material weakness in controls related to the company’s accounting for income taxes in connection with the CH2M business combination.”
Such an opinion raises the risk of investing in JEC, as there is a “reasonable possibility that a material misstatement of the company’s annual or interim financial statements will not be prevented or detected on a timely basis. “We provide more details on weak internal controls here.
Expensive Valuation Raises Risk
With a price-to-earnings (P/E) ratio of 20, JEC appears undervalued by traditional metrics. The Industrials sector has an average P/E ratio of 21 and the S&P 500 average sits at 22. However, JEC’s P/E is distorted by its non-operating income. JEC looks significantly more expensive when using earnings of $2.12/share (as opposed to reported earnings), as its P/E ratio rises to 46.
Our reverse discounted cash flow (DCF) model more rigorously assesses the valuation of this stock by quantifying the expectations for future profit growth baked into the stock price.
When we look at the expectations implied by its valuation, the stock also looks much more expensive. JEC’s economic book value, or no growth value, is currently $25/share, or 74% below the current stock price.
In order to justify its price of $97/share, JEC must improve its NOPAT margin to 4% (up from 3% TTM) and grow NOPAT by 8% compounded annually for the next 12 years. This expectation looks rather ambitious when one considers that JEC has grown NOPAT by just 2% compounded annually over the past decade. Further, TTM NOPAT is down 14% year-over-year. See the math behind this reverse DCF scenario.
Even if JEC achieves a NOPAT margin of 4% and grows NOPAT by 5% compounded annually (more than double its growth after past 10 years) over the next decade, the stock is worth $67/share today, a 31% downside to the current stock price. See the math behind this reverse DCF scenario.
Each of the above scenarios also assume JEC is able to grow revenue, NOPAT and FCF without increasing working capital or fixed assets. This assumption is unlikely but allows us to create best-case scenarios that demonstrate how high expectations embedded in the current valuation are. For reference, JEC’s invested capital has increased by an average of $769 million over the past 10 years.
The combination of overstated earnings and an expensive valuation earns JEC our Very Unattractive rating.
How You Can Leverage the Earnings Distortion Scorecard
“Trading strategies that exploit {adjustments provided by New Constructs} produce abnormal returns of 7-to-10% per year.” – Abstract
Core Earnings: New Data and Evidence presents a long/short strategy that holds the stocks with the most understated EPS and shorts the stocks with the most overstated earnings. Positions are opened in the month each 10-K is filed and held until the next 10-K is filed, or about a year.
This simple, low turnover strategy produced abnormal returns of 7-to-10% a year. These abnormal returns show that the market misses important data in the footnotes and that investors who adjust for unusual items can make more money. Click here for more details on our data offerings.
We have already used the Scorecard to identify two very successful Long Ideas:
- AbbVie (ABBV), which beat street estimates on November 1 and is already up 10% (compared to 3% for S&P 500) since our article.
- Qualcomm (QCOM), which beat street estimates on November 6 and is already up 16% (compared to 3% for S&P 500) since our article.
We’ve also used the Scorecard to identify the following earnings beats:
- HCA Healthcare (HCA): beat the street on October 29
- Arista Networks (ANET): beat the street on October 31
- DuPont (DD): beat the street on October 31
- Sysco (SYY): beat the street on November 4
- CVS Health (CVS): beat the street on November 6
- AmerisourceBergen (ABC): beat the street on November 7
Defining Earnings Distortion in This Analysis
In this report, Earnings Distortion includes:
Total Net Non-Operating Expense Hidden in Operating Earnings
- + Total Hidden Restructuring
- + Hidden Foreign Currency Expense
- + Hidden Other Real Estate Owned Expense
- + Hidden Acquisition and Merger Expense
- + Hidden Legal Regulatory & Insurance Expense
- + Hidden Derivative Related Expense
- + Hidden Other Financing Expense
- + Other Hidden Non-Recurring Expense
- + Total Hidden Recurring Pension
- + Total Hidden Non-Recurring Pension
- + Hidden Company Defined Other Expense
Reported Net Non-Operating Expense
- + Derivative Related Expense
- + Other Financing Expense
- + Company Defined Other Non-Operating Expense
- + Acquisition & Merger Expense
- + Legal, Regulatory, and Insurance Related Expense
- + Expenses/(Income) From Discontinued Operations
- + Foreign Currency Loss/(Gain)
- + Non-Operating Other Real Estate Owned Expense/(Income)
- + Other Non-Operating Expense/(Income)
- + Write-Downs (non-operating)
- + Restructuring Expense
- + Other Non-Recurring Expense/(Income)
Total Derived Datapoints
- + Goodwill amortization
- - ESO Expense (Employee Stock Options
- + Income Taxes on Non-Recurring Items
Net After-Tax Non-Operating Expense/(Income)
- + Loss/(Gain) From Discontinued Operations
- + Other After-tax Charge
See Figure I in the Appendix for the definition of core earnings and total adjustments used in the HBS & MIT Sloan paper.
Appendix 2 provides details on the most complete data set we offer clients here.
This article originally published on November 11, 2019.
Disclosure: David Trainer, Kyle Guske II, and Sam McBride receive no compensation to write about any specific stock, sector, style, or theme.
Follow us on Twitter, Facebook, LinkedIn, and StockTwits for real-time alerts on all our research.
Appendix 1
Figure I contains the definition of core earnings used in the HBS & MIT Sloan paper. Certain adjustment categories we included in the analysis above were aggregated into the definition below. We believe breaking out these adjustments is necessary to ensure all necessary adjustments are captured and accounted for in calculating core earnings.
Figure I: Core Earnings Defined in the HBS & MIT Sloan Paper
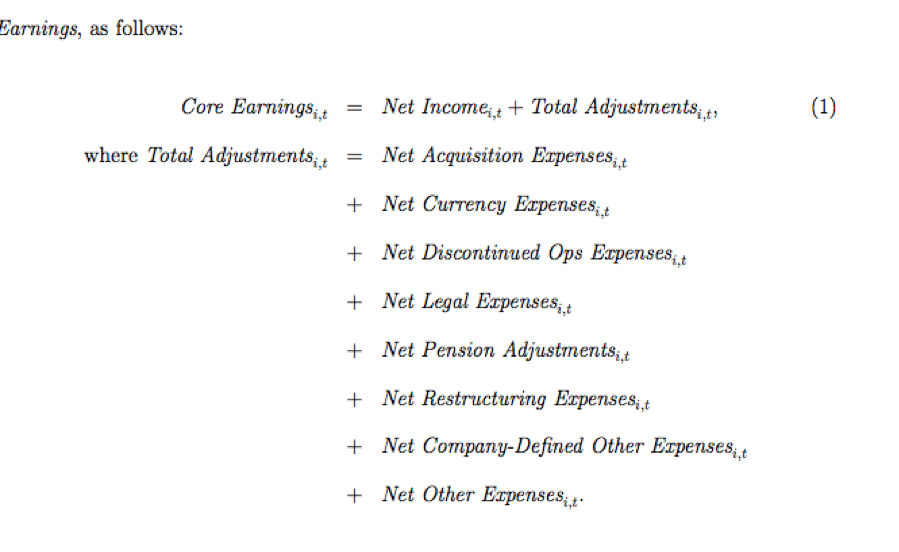
Sources: Core Earnings: New Data and Evidence
Appendix 2
The HBS paper focuses on core earnings for direct comparison with GAAP earnings, IBES and First Call earnings, and Compustat’s “income before extraordinary items” and “income minus special items”. Our preferred measure of profitability, net operating profit after tax (NOPAT), includes all the items in the HBS & MIT Sloan paper as well as several others. Our complete reconciliation of GAAP net income to NOPAT is in this data dictionary. To access this data for nearly all U.S. stocks from 1998 – 2018 click here.
[1] Earnings Distortion captures all the non-recurring adjustments featured in the HBS & MIT Sloan paper. More details here.