
In a recent e-letter, CEO David Trainer highlighted how we apply “Expectations Investing” in the valuation analysis of every stock we cover. In the e-letter, he went in depth on what our Company Model, and our reverse discounted cash flow (DCF) model, said about NVIDIA (NVDA).
Today, we’ve put together similar analysis on another high-flying stock, and one that we’ve long maintained is significantly overvalued, Netflix (NFLX).
Now, we’re not saying that Netflix, or NVIDIA for that matter, won’t see their stocks continue to rise beyond rational levels. Instead, we want to mathematically, and visually, show just how expensive NFLX is at current price levels.
Before we dive in, let’s first provide a bit of background on Expectations Investing, and how it relates to our reverse DCF model. Our favorite quote from the Expectations Investing website is:
“Investors who use Expectations Investing will have a fundamentally better way to evaluate all stocks, setting them on the path to success.”
While the concept of Expectations Investing is rather easy to understand, it is very difficult to apply in the real world, especially at scale. At New Constructs, one of our most valuable offerings is the application of Expectations Investing at scale, across 3,400+ stocks under coverage
What the heck is a “reverse” DCF model?
First, a quick note on the key concept behind how the “reverse” dynamic DCF model works. The first question we like to ask new analyst trainees is: would you rather be a fortune teller or a critic of a fortune teller?
We believe it is much easier to be a critic of someone trying to predict the future than to predict it oneself. And our reverse DCF models work the same way. These models do not attempt to predict the future. Instead, they reverse engineer the future cash flows required for the model to produce a value equal to the stock price. In other words, we start with the stock price and figure out what the future cash flows have to be to justify that stock price.
What the Default DCF Scenario Says About NFLX
Now, let’s show how we use our reverse discounted cash flow model to quantify the expectations baked into Netflix (NFLX) at $921/share.
In the Default scenario, our DCF model shows it would take Netflix over 100 years to generate the profits needed to justify its stock price. The Default scenario is based on:
- Consensus estimates for revenue growth
- Future NOPAT margins are roughly the same as past margins
- Capital efficiency improves pretty aggressively.
Quantifying the Expectations in NFLX: Getting the Mathematical Facts
Given that few investors want to think in terms of a hundred-year forecast horizon, we created two new scenarios for Netflix’s future cash flows: Optimistic and Pessimistic. Here’s a summary of what we changed versus the Default scenarios:
- Optimistic scenario: above consensus revenue growth and higher profit margins
- Pessimistic scenario: lower revenue and profit margins than Optimistic but still above consensus and TTM
Figure 2 is a picture from the Decision page in our company models. The purpose of the Decision page is to summarize the reverse DCF into a table and a few charts so clients can get a quick and easy read of the results of the model. We can break the Decision page down into a few parts:
- the summary table (Figure 1),
- the implied stock price charts (Figure 2), and
- the implied future revenue and ROIC (Figures 3 & 4).
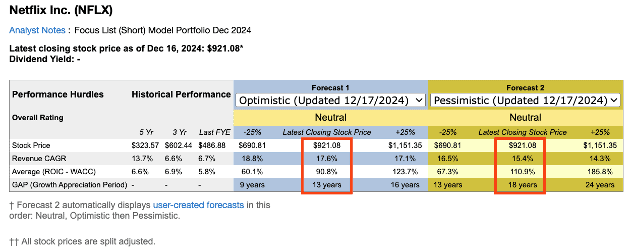
Figure 1, from left to right, shows:
- The grey section presents the key variables over recent history.
- Revenue CAGR (“CAGR” stands for Compound Annual Growth Rate)
- ROIC – WACC = Return on Invested Capital minus Weighted Average Cost of Capital
- GAP (Growth Appreciation Period) = our term for CAP (Competitive Advantage Period). They are exactly the same thing.
- Forecast 1 section shows the future performances required to justify the current price based on the Optimistic scenario.
- Forecast 2 section shows the future performances required to justify the current price based on the Pessimistic scenario.
This table allows for easy comparison between past performance of key variables to implied future performance.
Figure 1: Summary Tables for the Reverse Dynamic DCF for NFLX
Sources: New Constructs Company Valuation Models
To keep things simple, we’re going to focus on the tables based on the current stock price ($921.08/share).
- In the Optimistic scenario, to justify $921.08, Netflix must grow revenue at an 18% CAGR while achieving an average ROIC-WACC spread of 91% for the next 13 years.
- In the Pessimistic scenario, to justify $921.08, Netflix must grow revenue at a 15% CAGR while achieving an average ROIC-WACC spread of 111% for the next 18 years.
For reference, in the last fiscal year, Netflix grew revenue 6.7% year-over-year (YoY) and achieved an ROIC – WACC spread of 5.8%. Over the past three years, Netflix achieved a 6.6% revenue CAGR and an ROIC – WACC spread of 6.9%.
These are the mathematical facts about the company’s historical performance and the future performance implied by the stock’s valuation.
The True Meaning of Expectations Investing: What You Do with the Mathematical Facts
As an investor, the question you must answer is whether or not you believe the mathematical facts. Put another way, do you believe that Netflix can achieve the performance implied by its stock price. That question is the entire point of Expectations Investing. The beauty of Expectations Investing is that the investor does not have to predict the future. Instead, the investor simply determines whether or not he/she believes in the market’s prediction about the future of the company. The investor gets to be a critic of the future implied by the stock price.
Now, a key point here is that the only way to be a well-informed critic is to rigorously quantify the expectations embedded in the stock price. And, that is exactly what our reverse dynamic DCF models do for clients.
Specifically, our reverse DFC models enable investors to faithfully answer the key question required to make an informed decision about investing in Netflix is: Do I agree with the stock price’s prediction that Netflix can grow revenues and reach the ROIC-WACC spread for the respective GAPs shown in Figure 1.
- If your answer is yes, then the stock is fairly valued.
- If you think Netflix will do even better, then the stock is cheap.
- If you think Netflix will do worse, then the stock is expensive.
Quantifying the Expectations in NFLX: Revenue
Next, we’ll show how our models can make answering this question easy, through succinct visuals.
First, our dynamic DCF quantifies the market’s expectations based on common-sense operational metrics (e.g. revenue growth and ROIC) that you can compare to the historical performance of the business and to your own expectations about the future performance of the business. Valuation doesn’t have to be done through a multiple that’s difficult to understand.
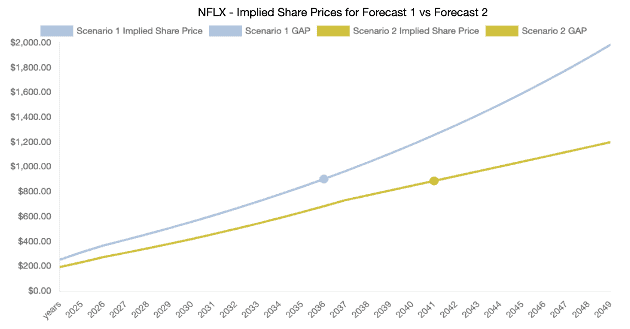
Figure 2 shows the implied share prices over multiple Growth Appreciation Periods so you can see how the different scenarios affect the valuation of the stock. Not surprisingly, the slope of the Optimistic line is steeper than the Pessimistic line because of the faster revenue CAGR assumptions in the Optimistic scenario.
This chart specifically shows how we find the market-implied GAPs. It shows how we run scenarios over as long a time frame as needed for the DCF model to get to the current stock price. The year in which the DCF model produces a stock value equal to the current stock price is the market-implied GAP. The market-implied GAP is important for many reasons, but, in particular, it is important for creating charts like Figure 3.
Figure 2: Implied Share Prices over Growth Appreciation Periods: NFLX
Sources: New Constructs Company Valuation Models
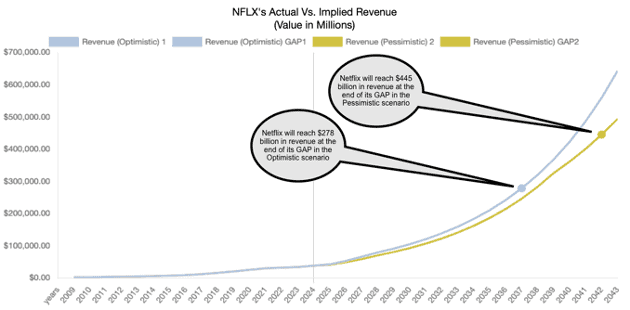
Figure 3 shows us how Netflix’s past revenue compares to the future revenues implied by each scenario.
This chart shows us that Netflix’s revenue will reach $278 billion at the end of its GAP for the Optimistic scenario[1] while its revenue will reach $445 billion at the end of its GAP for the Pessimistic Scenario.
The chart also shows the magnitude of the improvement in revenue compared to where the company has been in the past. Just look at how low and flat the revenue line is going back to 2009. The future implied revenues make the past revenue look miniscule.
Figure 3: Comparing Historical Revenue to Implied Future Revenue: Netflix
Sources: New Constructs Company Valuation Models
We need more context to truly conceptualize how large $278 billion and $445 billion in revenue is. Let’s start with the fact that Netflix’s trailing-twelve-months (TTM) revenue at the end of its 3Q24 was $37.6 billion, or less than 15% of the implied revenue in the Optimistic scenario and less than 1/10th the implied revenue in the Pessimistic scenario.
Beyond Netflix, only two companies in our coverage universe currently generate more than $445 billion in revenue: Walmart (WMT) and Amazon AMZN). Just 12 companies generate more than $278 billion in revenue over the TTM.
Here’s further perspective, $445 billion in revenue would make Netflix the 36th largest country, based on GDP per the International Monetary Fund’s (IMF) October 2024 World Economic Outlook, ahead of the likes of South Africa and Denmark.
We think it is safe to say the market’s expectations for Netflix’s future revenue are quite high.
Quantifying the Expectations in NFLX: ROIC
Revenues are just one piece of the valuation puzzle. We know companies can grow revenues and take market share if they slash prices and margins. In such a scenario, ROIC usually declines.
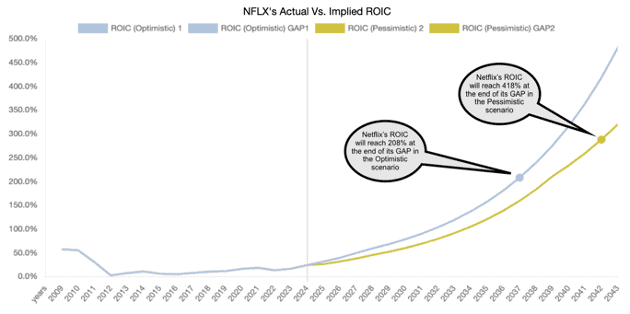
In other words, revenue growth at any level, but especially large revenue growth like that in the Optimistic and Pessimistic scenarios, is next to impossible to achieve while also increasing ROIC. So, to illustrate the optimism baked into both scenarios, we ran the same comparison for ROIC as we did for revenue, and the results are in Figure 4.
In the Optimistic Scenario, Netflix’s ROIC would reach 208% at the end of its GAP. In the Pessimistic scenario, Netflix’s ROIC would reach 418% at the end of its GAP.
Figure 4 shows the magnitude of the improvement in ROIC compared to where the company has been in the past.
Figure 4: Comparing Historical ROIC to Implied Future ROIC: NFLX
Sources: New Constructs Company Valuation Models
Just as with revenue, below we’ll provide additional context to understand how impressive it would be to achieve a 208% or 418% ROIC.
First, Netflix’s current ROIC is 24%, which is the highest it has been since 2011.
In the TTM, there are just eight companies in our entire coverage universe that generate an ROIC greater than 208%, and just one that generates an ROIC greater than 418%.
Over the past five years, an S&P 500 company has generated a ROIC greater than 300% just three times.
We think it is safe to say the market’s expectations for Netflix’s future ROIC are quite high.
Quantifying the Expectations in NFLX: NOPAT
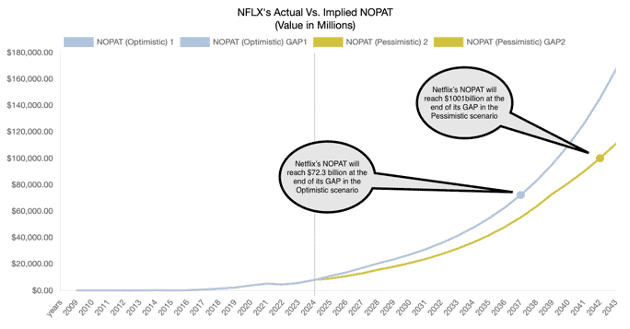
To finish up our visualization of the expectations baked into Netflix’s stock, we’ll analyze the implied net operating profit after-tax (NOPAT) in each of the scenarios above.
Per Figure 5, to illustrate the optimism baked into both scenarios, we ran the same comparison for NOPAT as we did for revenue and ROIC.
In the Optimistic Scenario, Netflix’s NOPAT would reach $72.3 billion at the end of its GAP. In the Pessimistic scenario, Netflix’s NOPAT would reach 100.1 billion at the end of its GAP.
Figure 5: Comparing Historical NOPAT to Implied Future NOPAT: NFLX
Sources: New Constructs Company Valuation Models
Below we’ll provide more context to understand how impressive it would be to achieve such NOPAT levels.
Netflix’s NOPAT over the TTM is $8.1 billion, which is the highest in the history of our model (goes back to 2002 for Netflix). Netflix’s current NOPAT is 11% and 8% of the implied NOPAT in the Optimistic and Pessimistic scenarios presented above, respectively.
Additionally, there are just three companies in our coverage universe that generate more than $72.3 billion in NOPAT over the TTM: Apple (AAPL), Microsoft (MSFT), and Alphabet (GOOGL). Only Apple generates more than $100.1 billion.
In other words, to justify its current stock price, Netflix must become either the fourth or second most profitable company in the world (assuming those companies don’t also grow profits), depending upon which scenario we analyze. Anything less, and the stock is not worth its current valuation.
We think it is safe to say the market’s expectations for Netflix’s future NOPAT are quite high.
So, What Is Netflix Worth?
Given the extremely optimistic expectations for revenue and profit growth baked into Netflix’s stock price, it is worth exploring just what the stock is worth.
The company’s economic book value, or no-growth value, is currently $134/share – or 85% below its current stock price.
Even if we assume the company:
- maintains its TTM NOPAT margin (21.5%) from 2024-2033,
- grows revenue at consensus estimates in 2024, 2025, and 2026, and
- grows revenue at 11% (equal to 2026 consensus) each year thereafter through 2033, then
the stock would be worth $326/share today – a 65% downside to the current stock price.
Even in this scenario, Netflix would generate $21.5 billion in NOPAT in 2033, which 2.6x its TTM NOPAT and higher than all but 19 companies under coverage in the TTM period.
In other words, if Netflix simply maintains current levels of profitability and grows revenues by expected rates, the stock holds significant downside risk.
And, here’s the best part. You don’t have to take our word for the right stock price for NFLX. You are now a well-informed critic who can make your own determination as to what the future might hold for Netflix.
This article was originally published on December 19, 2024.
Disclosure: David Trainer, Kyle Guske II, and Hakan Salt, receive no compensation to write about any specific stock, sector, style, or theme.
Questions on this report or others? Join our online community and connect with us directly.
[1] We use a no-growth terminal value in our DCF models. The formula is NOPAT(t+1)/WACC. Note that we believe a no-growth terminal value is necessary for a reverse dynamic DCF model to have integrity.