
Three new stocks make April’s Exec Comp Aligned with ROIC Model Portfolio, available to members as of April 14, 2023.
Recap from March Picks
Our Exec Comp Aligned with ROIC Model Portfolio (+3.1%) underperformed the S&P 500 (+4.8%) from March 15, 2023 through April 12, 2023. The best performing stock in the portfolio was up 13%. Overall, five out of the 15 Exec Comp Aligned with ROIC Stocks outperformed the S&P from March 15, 2023 through April 12, 2023.
This report leverages our cutting-edge Robo-Analyst technology to deliver proven-superior[1] fundamental research and support more cost-effective fulfillment of the fiduciary duty of care.
This Model Portfolio includes stocks that earn an Attractive or Very Attractive rating and align executive compensation with improving ROIC. This combination provides a unique list of long ideas as the primary driver of shareholder value creation is return on invested capital (ROIC).
New Stock Feature for April: Commercial Metals Company (CMC: $48/share)
Commercial Metals Company (CMC) is the featured stock in April’s Exec Comp Aligned with ROIC Model Portfolio.
Commercial Metals has grown revenue and NOPAT by 11% and 40% compounded annually, respectively, since 2016. The company’s NOPAT margin improved from 3% in 2016 to 12% in the trailing twelve months (TTM), while invested capital turns rose from 1.5 to 1.6 over the same time. Rising NOPAT margins and invested capital turns drive the company’s return on invested capital (ROIC) from 4% in 2016 to 19% in the TTM.
Figure 1: Commercial Metals’ Revenue & NOPAT: 2016 – TTM
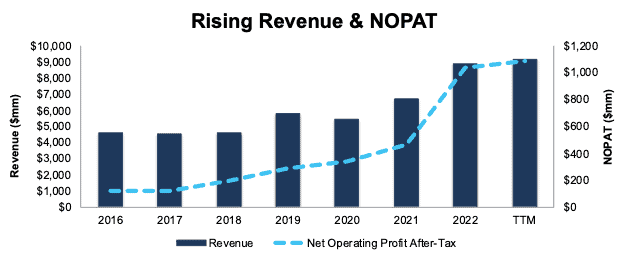
Sources: New Constructs, LLC and company filings
Executive Compensation Properly Aligns Incentives
Commercial Metals’ executive compensation plan aligns the interests of executives and shareholders by tying a portion of its Annual Cash Incentive Plan to “Return on Invested Capital for Compensation Purposes”, according to the company’s proxy statement.
The company’s inclusion of ROIC as a performance goal has helped create shareholder value through rising ROIC and economic earnings. When we calculate ROIC using our superior fundamental data, we find that Commercial Metals’ ROIC has increased from 6% in 2012 to 19% in the TTM. Economic earnings rose from $68 million to $631 million over the same time.
Figure 2: Commercial Metals International’s ROIC: 2012 – TTM
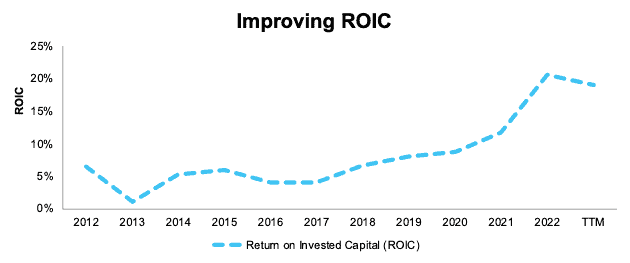
Sources: New Constructs, LLC and company filings
CMC Has Further Upside
At the current price of $48/share, CMC has a price-to-economic book value (PEBV) ratio of 0.5. This ratio implies the market expects Commercial Metals’ NOPAT to permanently fall by 50%. This expectation seems overly pessimistic for a company that has grown NOPAT 17% compounded annually over the past decade and 16% compounded annually over the past two decades.
If Commercial Metals’ NOPAT margin falls to 6% (vs. 12% in the TTM) and the company grows revenue by 7% compounded annually over the next decade, the stock would be worth $80/share today – a 67% upside. See the math behind this reverse DCF scenario. In this scenario, Commercial Metals’ NOPAT in 2032 would be unchanged from TTM levels.
For reference, Commercial Metals has grown NOPAT by 17% compounded annually over the past decade. Should the company grow NOPAT more in line with historical growth rates, the stock has even more upside.
Critical Details Found in Financial Filings by Our Robo-Analyst Technology
Below are specifics on the adjustments we made based on Robo-Analyst findings in Commercial Metals’ 10-K:
Income Statement: we made $367 million in adjustments with a net effect of removing $184 million in non-operating income (2% of revenue). Clients can see all adjustments made to Commercial Metals’ income statement on the GAAP Reconciliation tab on the Ratings page on our website.
Balance Sheet: we made $2.2 billion in adjustments to calculate invested capital with a net decrease of $47 million. One of the largest adjustments was $544 million (11% of reported net assets) in asset write-downs. Clients can see all adjustments made to Commercial Metals’ balance sheet on the GAAP Reconciliation tab on the Ratings page on our website.
Valuation: we made $1.8 billion in adjustments, with a net effect of decreasing shareholder value by $1.5 billion. The most notable adjustment to shareholder value was $303 million in deferred tax liabilities. This adjustment represents 5% of Commercial Metals’ market cap. Clients can see all adjustments to Commercial Metals’ valuation on the GAAP Reconciliation tab on the Ratings page on our website.
This article was originally published on April 24, 2023.
Disclosure: David Trainer, Kyle Guske II, and Italo Mendonça receive no compensation to write about any specific stock, style, or theme.
Questions on this report or others? Join our Society of Intelligent Investors and connect with us directly.
[1] Our research utilizes our Core Earnings, a more reliable measure of profits, as proven in Core Earnings: New Data & Evidence, written by professors at Harvard Business School (HBS) & MIT Sloan and published in The Journal of Financial Economics.