
Twelve new stocks make our Safest Dividend Yields Model Portfolio this month, which was made available to members on February 18, 2022.
Recap from January’s Picks
On a price return basis, our Safest Dividend Yields Model Portfolio (+0.1%) outperformed the S&P 500 (0.0%) by 0.1% from January 20, 2022 through February 16, 2022. On a total return basis, the Model Portfolio (+0.4%) outperformed the S&P 500 (0.0%) by 0.4% over the same time. The best performing large cap stock was up 15% and the best performing small cap stock was up 5%. Overall, 8 out of the 20 Safest Dividend Yield stocks outperformed their respective benchmarks (S&P 500 and Russell 2000) from January 20, 2022 through February 16, 2022.
More reliable & proprietary fundamental data, proven in The Journal of Financial Economics, drives our research and provides investors with a new source of alpha. Our proprietary Robo-Analyst technology[1] scales our forensic accounting expertise (featured in Barron’s) across thousands of stocks[2] to produce an unrivaled database of fundamental data.
This Model Portfolio only includes stocks that earn an Attractive or Very Attractive rating, have positive free cash flow and economic earnings, and offer a dividend yield greater than 3%. Companies with strong free cash flow provide higher quality and safer dividend yields because we know they have the cash to support the dividend. We think this portfolio provides a uniquely well-screened group of stocks that can help clients outperform.
Featured Stock for February: Conagra Brands, Inc. (CAG: $36/share)
Conagra Brands, Inc. (CAG) is the featured stock in February’s Safest Dividend Yields Model Portfolio.
Conagra grew revenue and net operating profit after-tax (NOPAT) by 12% and 22% compounded annually, respectively, from fiscal 2018 (FYE is 5/30) to fiscal 2021. Conagra’s rising NOPAT drove economic earnings from $290 million to $929 million over the same time. Over the trailing twelve months (TTM), economic earnings are $693 million, which, while down from fiscal 2021, are still higher than all but four years since 1998.
Figure 1: Conagra’s Economic Earnings Since Fiscal 2018
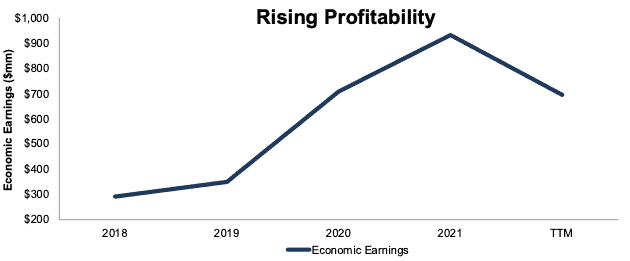
Sources: New Constructs, LLC and company filings
Free Cash Flow Supports Dividend Payments
Conagra has paid dividends every year since fiscal 1990 and increased its dividend from $0.90/share in fiscal 2017 to $1.04/share in fiscal 2021. The current regular quarterly dividend, when annualized, provides a 3.5% dividend yield.
In fiscal 2019, Conagra acquired Pinnacle Foods Inc. for ~$10.9 billion, which contributed to the firm’s -$10.5 billion free cash flow (FCF) that year. Excluding fiscal 2019, Conagra’s FCF has exceeded its dividend payment every year. As FCF has improved from $562 million in fiscal 2018 (the year before the acquisition) to $968 million TTM, Conagra easily generates enough cash to support raising its dividend. In fiscal 2020 and 2021, Conagra generated $3.3 billion (19% of current market cap) in FCF while paying $888 million in dividends.
Figure 2: Conagra’s FCF vs. Dividends Since Fiscal 2017
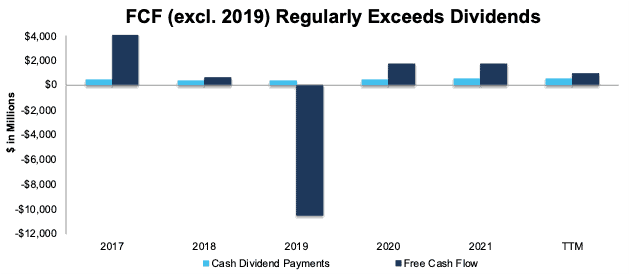
Sources: New Constructs, LLC and company filings
Companies with strong FCF provide higher quality dividend yields because we know the firm has the cash to support its dividend. On the other hand, dividends from companies with low or negative FCF cannot be trusted as much because the company may not be able to sustain paying dividends.
Conagra Is Undervalued
At its current price of $36/share, Conagra has a price-to-economic book value (PEBV) ratio of 0.5. This ratio means the market expects Conagra’s NOPAT to permanently decline by 50%. This expectation seems overly pessimistic given that Conagra grew NOPAT by 5% compounded annually over the past decade.
Even if Conagra’s NOPAT margin falls to 11% (five-year low, compared to 12% TTM), and the company’s NOPAT falls by 2% compounded annually over the next decade, the stock is worth $69/share today – a 92% upside. See the math behind this reverse DCF scenario. In this scenario, Conagra’s NOPAT in fiscal 2031 is 3% below TTM levels. Should the company grow NOPAT more in line with historical growth rates, the stock has even more upside.
Critical Details Found in Financial Filings by Our Robo-Analyst Technology
Below are specifics on the adjustments we make based on Robo-Analyst findings in Conagra’s 10-K and 10-Qs:
Income Statement: we made $813 million in adjustments with a net effect of removing $227 million in non-operating expenses (2% of revenue). Clients can see all adjustments made to Conagra’s income statement on the GAAP Reconciliation tab on the Ratings page on our website.
Balance Sheet: we made $6.1 billion in adjustments to calculate invested capital with a net increase of $5.4 billion. The most notable adjustment was $4.2 billion (22% of reported net assets) in asset write-downs. See all adjustments made to Conagra’s balance sheet on the GAAP Reconciliation tab on the Ratings page on our website.
Valuation: we made $12.7 billion in adjustments with a net effect of reducing shareholder value by $12.4 billion. Apart from total debt, one of the most notable adjustments to shareholder value was $1.2 billion in deferred tax liabilities. This adjustment represents 7% of Conagra’s market value. See all adjustments to Conagra’s valuation on the GAAP Reconciliation tab on the Ratings page on our website.
This article originally published on February 24, 2022.
Disclosure: David Trainer, Kyle Guske II, and Matt Shuler receive no compensation to write about any specific stock, style, or theme.
Follow us on Twitter, Facebook, LinkedIn, and StockTwits for real-time alerts on all our research.
[1] Harvard Business School features our research automation technology in the case Disrupting Fundamental Analysis with Robo-Analysts.
[2] See how our models overcome flaws in Bloomberg and Capital IQ’s (SPGI) analytics in the detailed appendix of this paper.