
Two new stocks make July’s Exec Comp Aligned with ROIC Model Portfolio, available to members as of July 12, 2019.
The success of this Model Portfolio highlights the value of our Robo-Analyst technology[1], which scales our forensic accounting expertise (featured in Barron’s) across thousands of stocks.
This Model Portfolio only includes stocks that earn an Attractive or Very Attractive rating and align executive compensation with improving ROIC. We think this combination provides a uniquely well-screened list of long ideas because return on invested capital (ROIC) is the primary driver of shareholder value creation.[2]
New Stock Feature for July: Johnson Outdoors (JOUT: $72/share)
Johnson Outdoors (JOUT) is the featured stock in July’s Exec Comp Aligned with ROIC Model Portfolio.
Since 2015, JOUT has grown revenue by 8% compounded annually and after-tax operating profit (NOPAT) by 49% compounded annually. Trailing twelve month (TTM) NOPAT is up 17% over the prior TTM period. Profit growth has been fueled by rising NOPAT margins, which are up from 3% in 2015 to 9% TTM.
Figure 1: JOUT Profit Growth Since 2015
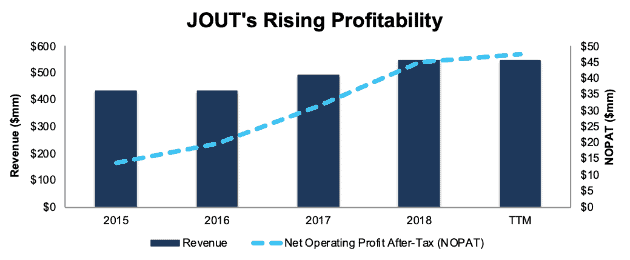
Sources: New Constructs, LLC and company filings
Executive Compensation Plan Helps Drive Shareholder Value Creation
JOUT added return on invested capital (ROIC) to its executive compensation plan in fiscal 2016. Before ROIC was an executive compensation performance metric, JOUT’s ROIC declined from 6% in 2013 to 5% in 2015. Since adding it, ROIC has improved to 14% TTM. Last year, equity based incentive awards were subject to downward adjustments in the event JOUT did not achieve a minimum ROIC each year in a three-year performance period.
JOUT’s executive compensation plan lowers the risk of investing in this stock because we know executives’ interests are tied to shareholders’ interests.
JOUT Provides Significant Upside Potential
At its current price of $72/share, JOUT has a price-to-economic book value (PEBV) ratio of 1.0. This ratio means the market expects JOUT’s NOPAT to never meaningfully grow from its current levels. This expectation seems pessimistic given that JOUT has grown NOPAT by 10% compounded annually over the past two decades.
If JOUT can maintain 2018 NOPAT margins of 8% (below 9% TTM) and grow NOPAT by just 4% compounded annually for the next decade, the stock is worth $91/share today – a 26% upside. See the math behind this dynamic DCF scenario.
Critical Details Found in Financial Filings by Our Robo-Analyst Technology
As investors focus more on fundamental research, research automation technology is needed to analyze all the critical financial details in financial filings. Below are specifics on the adjustments we make based on Robo-Analyst findings in Johnson Outdoors’ 2018 10-K:
Income Statement: we made $19 million of adjustments, with a net effect of removing $4 million in non-operating expense (1% of revenue). You can see all the adjustments made to JOUT’s income statement here.
Balance Sheet: we made $341 million of adjustments to calculate invested capital with a net increase of $3 million. One of the largest adjustments was $107 million in asset write-downs. This adjustment represented 35% of reported net assets. You can see all the adjustments made to JOUT’s balance sheet here.
Valuation: we made $81 million of adjustments with a net effect of increasing shareholder value by $1 million. The largest adjustment to shareholder value was $39 million in operating leases. This adjustment represents 5% of JOUT’s market cap. See all adjustments to JOUT’s valuation here.
This article originally published on July 17, 2019.
Disclosure: David Trainer, Kyle Guske II, and Sam McBride receive no compensation to write about any specific stock, style, or theme.
Follow us on Twitter, Facebook, LinkedIn, and StockTwits for real-time alerts on all our research.
[1] Harvard Business School features the powerful impact of our research automation technology in the case New Constructs: Disrupting Fundamental Analysis with Robo-Analysts.
[2] This paper compares our analytics on a mega cap company to other major providers. The Appendix details exactly how we stack up.