
Four new stocks make October’s Exec Comp Aligned with ROIC Model Portfolio, available to members as of October 16, 2019.
Recap from September’s Picks
Our Exec Comp Aligned with ROIC Model Portfolio (-1.3%) outperformed the S&P 500 (-1.7%) from September 13, 2019 through October 14, 2019. The best performing stock in the portfolio was up 8%. Overall, eight out of the 15 Exec Comp Aligned with ROIC Stocks outperformed the S&P from September 13, 2019 through October 14, 2019.
Only our research utilizes the superior data and earnings adjustments featured by the Harvard Business School and MIT Sloan paper, "Core Earnings: New Data and Evidence.” The success of this Model Portfolio highlights the value of our Robo-Analyst technology[1], which scales our forensic accounting expertise (featured in Barron’s) across thousands of stocks.
This Model Portfolio only includes stocks that earn an Attractive or Very Attractive rating and align executive compensation with improving ROIC. We think this combination provides a uniquely well-screened list of long ideas because return on invested capital (ROIC) is the primary driver of shareholder value creation.[2]
New Stock Feature for October: Kimball International (KBAL: $21/share)
Kimball International (KBAL) is the featured stock in October’s Exec Comp Aligned with ROIC Model Portfolio.
Since fiscal 2015, KBAL has grown revenue by 6% compounded annually and after-tax operating profit (NOPAT) by 22% compounded annually. Profit growing faster than revenue is a direct result of KBAL’s NOPAT margin increasing from 3% in 2015 to 5% in fiscal 2019.
Figure 1: KBAL’s Revenue & NOPAT Since 2015
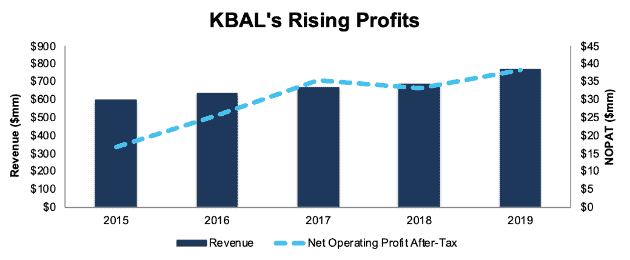
Sources: New Constructs, LLC and company filings
Executive Compensation Plan Helps Drive Shareholder Value Creation
With the exception of fiscal 2018, KBAL has include some form of economic profit, return on capital, or return on invested capital in its executive compensation plan in each year since 1996. In fiscal 2018, the Compensation Committee replaced return on capital with return on equity when determining performance shares. However, this shift was short-lived, and after just one year (in which its ROIC fell), return on capital was added back to the exec comp plan.
In fiscal 2019, annual performance shares were earned based on achieving a target annual return on capital goal. For fiscal 2020, the annual performance share target will be based on annual return on invested capital. The Compensation Committee made this change “because it [ROIC] is a more common metric utilized by investors to measure performance relative to the capital invested in a business.”
Per Figure 2, KBAL has improved its ROIC from 5% in fiscal 2015 to 15% in fiscal 2019. KBAL’s executive compensation plan lowers the risk of investing in this stock because we know executives’ interests are tied to shareholders’ interests.
Figure 2: KBAL’s ROIC Since 2015
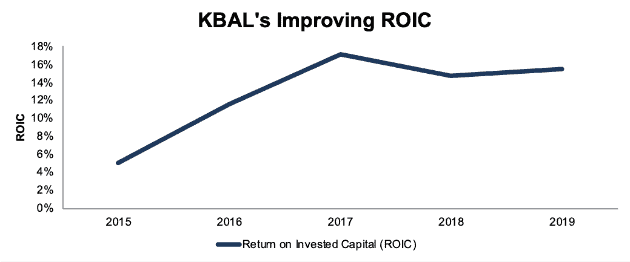
Sources: New Constructs, LLC and company filings
KBAL Is Undervalued
At its current price of $21/share, KBAL has a price-to-economic book value (PEBV) ratio of 1.1. This ratio means the market expects KBAL’s NOPAT to grow by only 10% over the remaining life of the firm. This expectation seems pessimistic given KBAL has grown NOPAT by 22% compounded annually since fiscal 2015 and 19% compounded annually over the past decade.
If KBAL can maintain fiscal 2019 NOPAT margins (5%) and grow NOPAT by just 6% compounded annually over the next decade, the stock is worth $26/share today – a 24% upside. See the math behind this reverse DCF scenario.
Critical Details Found in Financial Filings by Our Robo-Analyst Technology
As investors focus more on fundamental research, research automation technology is needed to analyze all the critical financial details in financial filings as shown in the Harvard Business School and MIT Sloan paper, "Core Earnings: New Data and Evidence”.
Below are specifics on the adjustments we make based on Robo-Analyst findings in Kimball International’s fiscal 2019 10-K:
Income Statement: we made $15 million of adjustments, with a net effect of removing $1 million in non-operating income (<1% of revenue). You can see all the adjustments made to KBAL’s income statement here.
Balance Sheet: we made $197 million of adjustments to calculate invested capital with a net increase of $10 million. One of the largest adjustments was $65 million in asset write-downs. This adjustment represented 28% of reported net assets. You can see all the adjustments made to KBAL’s balance sheet here.
Valuation: we made $90 million of adjustments with a net effect of increasing shareholder value by $46 million. The largest adjustment to shareholder value was $68 million in excess cash. This adjustment represents 9% of KBAL’s market cap. See all adjustments to KBAL’s valuation here.
This article originally published on October 24, 2019.
Disclosure: David Trainer, Kyle Guske II, and Sam McBride receive no compensation to write about any specific stock, style, or theme.
Follow us on Twitter, Facebook, LinkedIn, and StockTwits for real-time alerts on all our research.
[1] Harvard Business School features the powerful impact of our research automation technology in the case New Constructs: Disrupting Fundamental Analysis with Robo-Analysts.
[2] This paper compares our analytics on a mega cap company to other major providers. The Appendix details exactly how we stack up.