
With a new president in office and geopolitical tensions rising, we expect high stock market volatility to continue in the new year. Volatility brings both risk and reward. Some stocks will rise, and others will fall. If you do your diligence, you can take advantage of the unpredictable markets.
Look everyone deserves good research that they know they can trust – just as we explained in our recent training, Unveiling a Trust-Based Rating System for Smarter Investing.
The S&P 500 continues to rise despite seeing its earnings estimates revised lower to end 2024. The valuations of many stocks seem to be increasingly disconnected from their fundamentals.
Is this disconnect now a feature and not a bug of the stock market?
We’re not sure. And, if you’re not sure, we recommend caution because when the corrections come, they could be quite severe. Evidence of an historically overvalued market continues to mount. How do you protect yourself?
One excellent answer to that question is our Most Dangerous Stocks Model Portfolio. This Model Portfolio contains the worst of the worst stocks in the entire market. You want to avoid these stocks at all cost!
We leverage our superior fundamental data to glean insights into the true profits of these stocks, which also have nosebleed valuations. Misleading profits plus an overvalued stock are a recipe for disaster for your portfolio.
Our research rescues you from being left in the dark by Wall Street.
Today, we’re giving you a free stock pick. We are sharing this month’s featured stock for our Most Dangerous Stocks Model Portfolio.
This feature provides a concise summary of how we pick stocks for this Model Portfolio. It is not a full Danger Zone report, but it gives you insight into the rigor of our research and approach to picking stocks. Whether you’re a subscriber or not, we think it is important that you’re able to see our research on stocks on a regular basis. We’re proud to share our work. Please feel free to share it with your friends and family.
We update this Model Portfolio monthly. January’s Most Attractive and Most Dangerous stocks Model Portfolios were updated and published for clients on January 8, 2024.
Free Most Dangerous Stock Pick: Shenandoah Telecommunications (SHEN)
Shenandoah Telecommunications (SHEN: $12/share) is the featured stock from January’s Most Dangerous Stocks Model Portfolio.
Shenandoah’s net operating profit after tax (NOPAT) margin fell from 19% in 2018 to -4% in the TTM, while the company’s invested capital turns fell from 0.4 to 0.3 over the same time. Falling NOPAT margins and invested capital turns drive Shenandoah’s return on invested capital (ROIC) from 7% in 2018 to -1% in the TTM.
Shenandoah’s economic earnings, the true earnings of the business, which take into account changes to the balance sheet, fell from $17 million in 2018 to -$98 million in the TTM. Meanwhile, the company’s GAAP net income rose from $47 million to $199 million over the same time. Whenever GAAP earnings rise while economic earnings decline, investors should beware.
Figure 1: Shenandoah’ Economic vs GAAP Earnings Since 2018
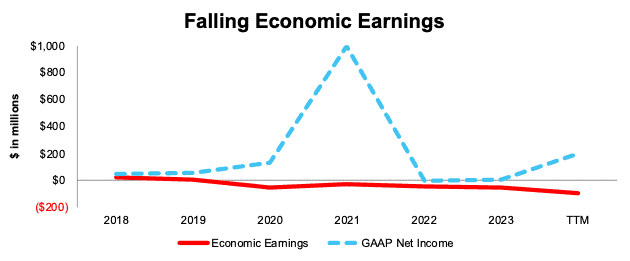
Sources: New Constructs, LLC and company filings
SHEN Provides Poor Risk/Reward
Despite its poor and declining fundamentals, Shenandoah’s stock is priced for significant profit growth, and we believe the stock is overvalued.
To justify its current price of $12/share, Shenandoah must improve its NOPAT margin to 20% (equal to best-ever NOPAT margin) and grow revenue by 5% (compared to <1% over the last decade) compounded annually over the next eight years. In this scenario, Shenandoah grows its NOPAT 30% compounded annually to $85 million in 2031. We think these expectations are overly optimistic, especially considering the company’s NOPAT fell from $117 million in 2018 to -$14 in the TTM.
Even if Shenandoah improves its NOPAT margin to 15% (above five-year average NOPAT margin of 4% and TTM margin of -4%) and grows revenue 5% compounded annually through 2031, the stock would be worth no more than $6/share today – a 47% downside to the current stock price.
Each of these scenarios also assumes Shenandoah can grow revenue, NOPAT, and FCF without increasing working capital or fixed assets. This assumption is unlikely but allows us to create best case scenarios that demonstrate the high expectations embedded in the current valuation.
Critical Details Found in Financial Filings by Our Robo-Analyst Technology
Below are specifics on the adjustments we made based on Robo-Analyst findings in Shenandoah’s 10-Qs and 10-Ks:
Income Statement: we made just under $10 million in adjustments, with a net effect of removing just under $5 million in non-operating expenses. Professional members can see all adjustments made to Shenandoah’s income statement on the GAAP Reconciliation tab on the Ratings page on our website.
Balance Sheet: we made over $290 million in adjustments to calculate invested capital with a net decrease of over $150 million. One of the most notable adjustments was for asset write downs. Professional members can see all adjustments made to Shenandoah’s balance sheet on the GAAP Reconciliation tab on the Ratings page on our website.
Valuation: we made just under $670 million in adjustments to shareholder value with a net decrease of over $580 million. The most notable adjustment to shareholder value was for total debt. Professional members can see all adjustments to Shenandoah’s valuation on the GAAP Reconciliation tab on the Ratings page on our website.
This article was originally published on January 24, 2025.
Disclosure: David Trainer, Kyle Guske II, and Hakan Salt receive no compensation to write about any specific stock, style, or theme.
Questions on this report or others? Join our online community and connect with us directly.