
Our analysis of return on invested capital (ROIC) by sector reveals few surprises. Technology leads the way while Utilities bring up the rear. Cyclical and commodity-driven industries like Basic Materials, Energy, and Consumer Cyclicals tend to have more volatile ROIC’s while Industrials, Utilities, Telecom, and Consumer Non-Cyclicals have less variance. Finally, cap-weighted ROIC is higher than aggregate ROIC (based on dividing the total NOPAT by the total Average Invested Capital) in every sector, which shows that the market rewards higher ROIC companies with higher valuations. Figure 1 shows cap-weighted average ROIC by sector dating back to 2000.[1]
Figure 1: Weighted Average ROIC by Sector Since 2000
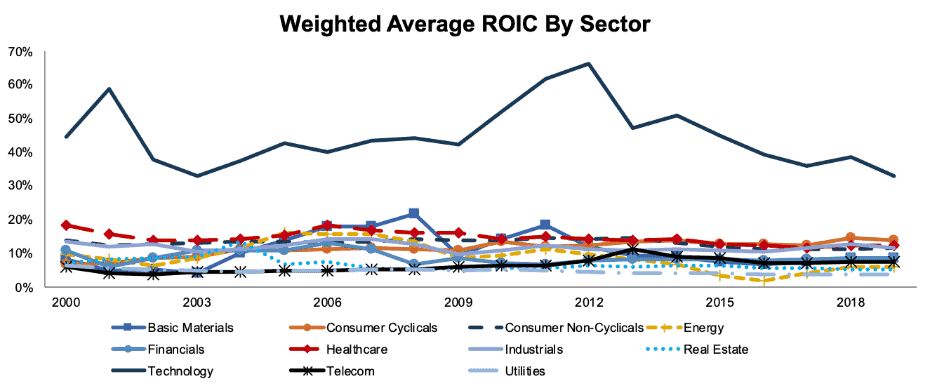
Sources: New Constructs, LLC and company filings.
The Technology sector’s high ROIC makes it hard to see much detail for the other sectors, so we exclude Technology and break out the sectors by high and low variance in Figures 2 and 3.
High vs. Low Variance Sectors: Weighted Average ROIC
Figure 2: Weighted Average ROIC by Sector Since 2000: High Variance excluding the Tech Sector
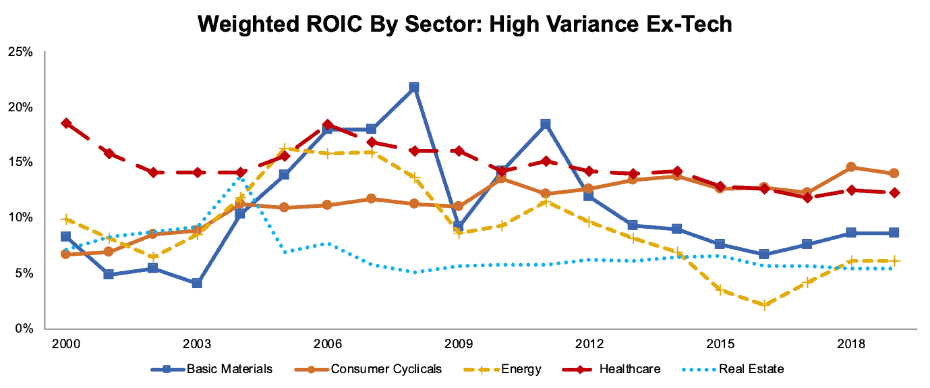
Sources: New Constructs, LLC and company filings.
The Consumer Cyclicals sector stands out in Figure 2. It has gone from an ROIC of 6% in 2000 – the lowest of the sectors in Figure 3 and third-lowest overall – to 14% TTM, second-highest overall behind Technology.
Real Estate has been consistently among the worst sectors by ROIC, except for a brief spell of high profitability in the early 2000’s. Real Estate is also our worst-rated sector.
Figure 3: Weighted Average ROIC by Sector Since 2000: Low Variance
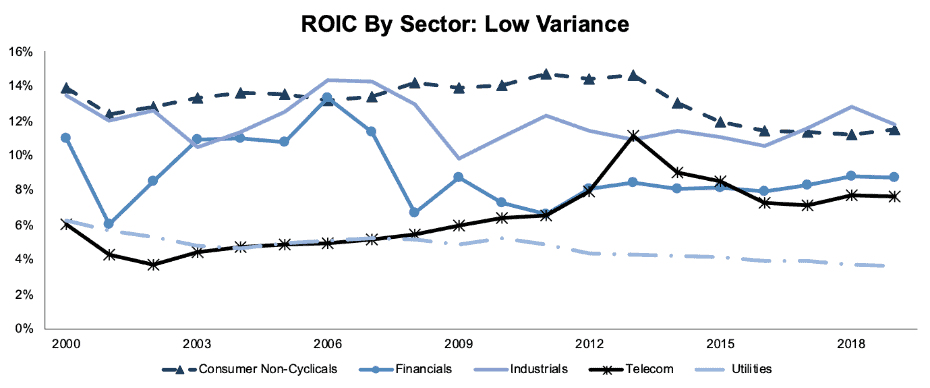
Sources: New Constructs, LLC and company filings.
The Industrials sector stands out for its unusually high and stable ROIC. The sector’s ROIC of 9.8% in 2009 was the only year since 2000 where its weighted average ROIC fell below 10%.
Currently, our model is bullish on low-variance sectors. Telecom, Financials, and Consumer Non-Cyclicals all earn Attractive-or-better ratings according to our sector rating methodology.
Meanwhile, Utilities is both the least volatile and the least profitable sector over time.
Aggregate ROIC by Sector
Figure 4 shows aggregate ROIC by sector dating back to 1998. The gap between Technology and the rest of the market is not as pronounced here, which speaks to the outsized impact the mega-cap tech companies like Apple (AAPL) and Microsoft (MSFT) have on the sector.
Figure 4: Aggregate ROIC by Sector Since 1998
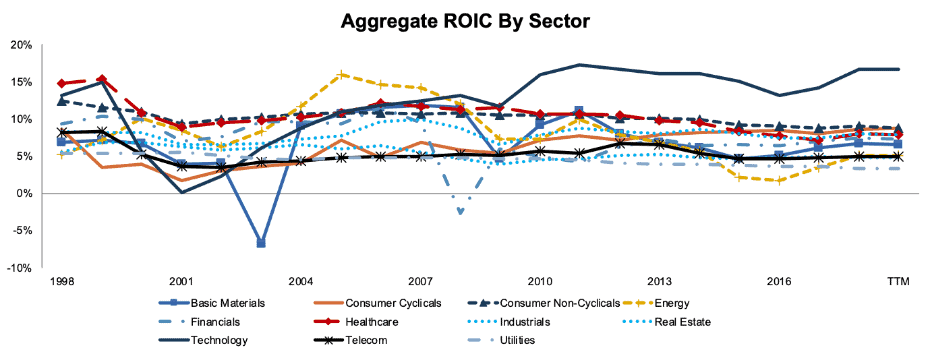
Sources: New Constructs, LLC and company filings.
Aggregate ROIC also displays more volatility than weighted ROIC. While weighted ROIC never fell below 0% for any sector, aggregate ROIC for the Basic Materials sector turned negative in 2003, and it fell below 0% for Financials in 2008.
High Vs. Low Variance Sectors: Aggregate ROIC
Figures 5 and 6 show more detail by breaking out aggregate ROIC for high-variance and low-variance sectors (excluding Technology).
Figure 5: Aggregate ROIC by Sector Since 1998: High Variance
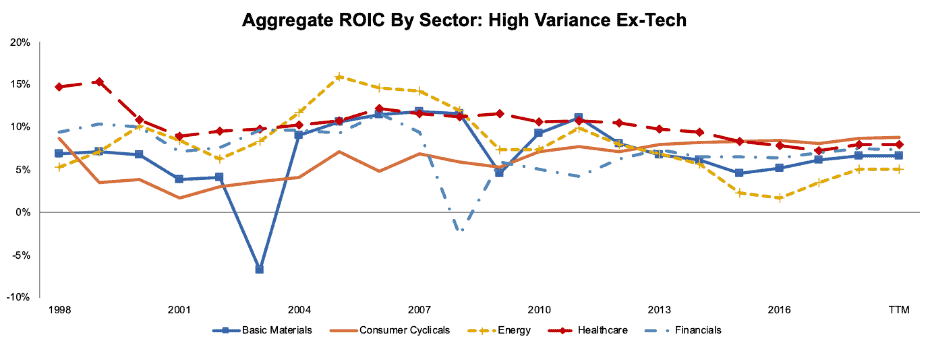
Sources: New Constructs, LLC and company filings.
Figure 6: Weighted Average ROIC by Sector Since 2000: Low Variance
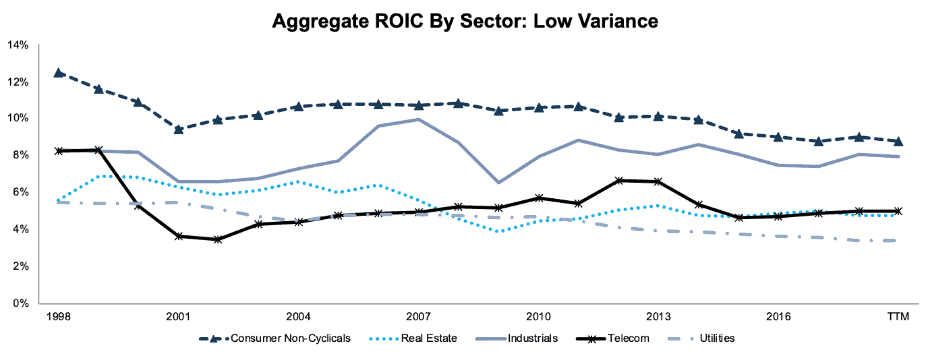
Sources: New Constructs, LLC and company filings.
Figures 7-29 will show cap-weighted ROIC for each sector, as well as aggregate NOPAT and Invested Capital. For each graph of NOPAT vs. Invested Capital, the Invested Capital axis is 10x the NOPAT axis, meaning that if the two lines are even that equates to a 10% ROIC.
Basic Materials
Figure 7: Weighted Average ROIC: Basic Materials
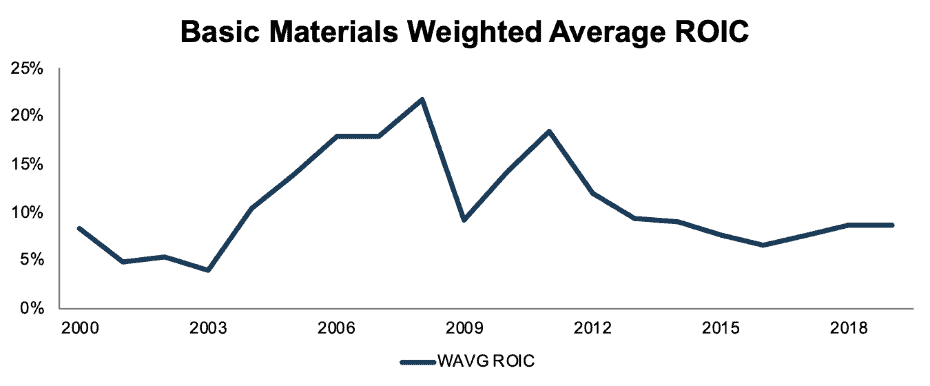
Sources: New Constructs, LLC and company filings.
As you’d expect with a commodity-driven sector, Basic Materials exhibits high levels of variance in its ROIC over time. The sector appears to be recovering along with commodity prices over the past two years.
Figure 8: NOPAT vs. Average Invested Capital: Basic Materials
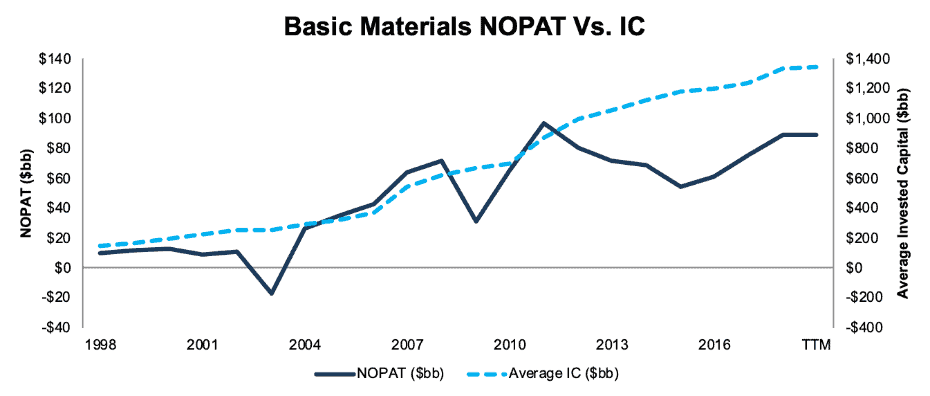
Sources: New Constructs, LLC and company filings.
Figure 8 shows that Basic Materials companies continued to invest from 2011-2015 even as their NOPAT steadily declined. Unlike previous declines in 2003 and 2009, which were v-shaped declines and recoveries, the recent cycle in this sector has been much smoother and more prolonged.
Consumer Cyclicals
Figure 9: Weighted Average ROIC: Consumer Cyclicals
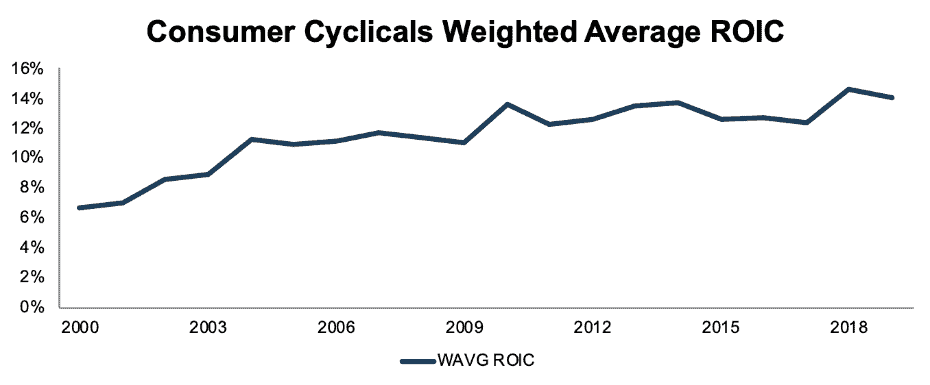
Sources: New Constructs, LLC and company filings.
As noted above, Consumer Cyclicals has shown an impressive improvement in ROIC since 2000. Notably, the Retail sub-sector has been a big part of this trend, with its ROIC improving from 9% in 2000 to 14% TTM.
Figure 10: NOPAT vs. Average Invested Capital: Consumer Cyclicals
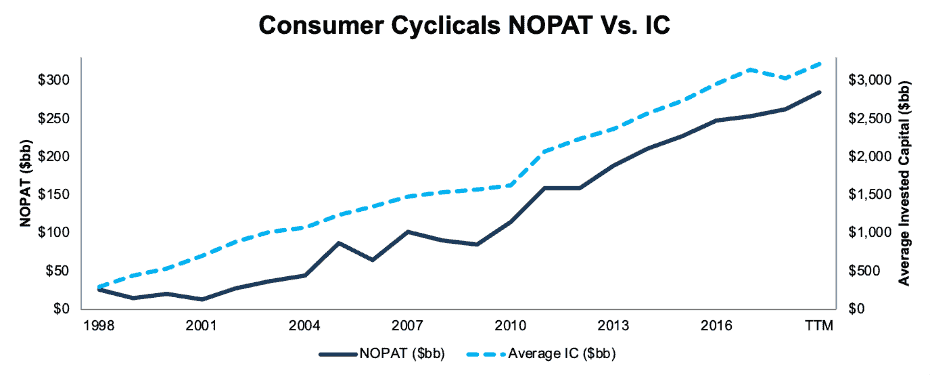
Sources: New Constructs, LLC and company filings.
Despite the steady increase in ROIC, Consumer Cyclicals companies decreased their Invested Capital in 2018. However, Invested Capital has ticked back up TTM, so it’s difficult to tell if this is a sign of pessimism or a short-term blip.
Consumer Non-Cyclicals
Figure 11: Weighted Average ROIC: Consumer Non-Cyclicals
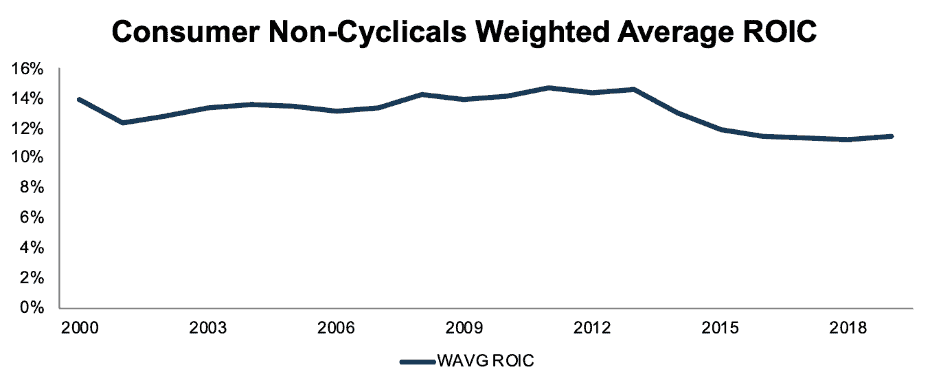
Sources: New Constructs, LLC and company filings.
Consumer Non-Cyclicals has been a historically stable sector, but ROIC has dipped in the past few years. Part of this decline can be attributed to a wave of overpriced acquisitions in the sector, with giants like Kraft Heinz (KHC) and Anheuser Busch InBev (BUD) adding huge amounts of Goodwill to their balance sheets.
Figure 12: NOPAT vs. Average Invested Capital: Consumer Non-Cyclicals
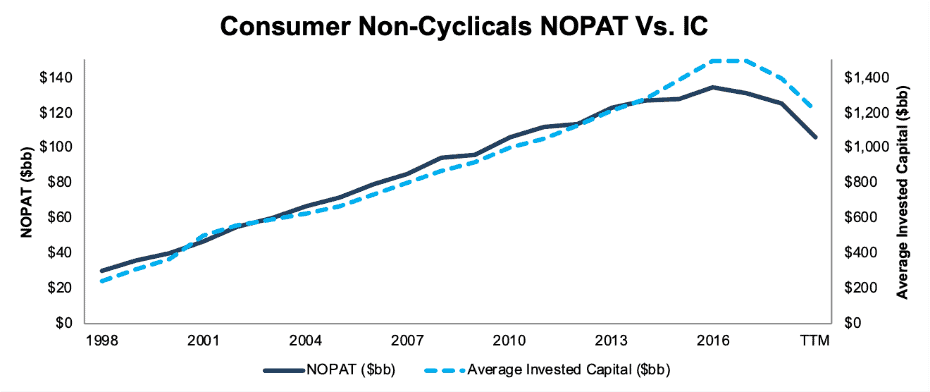
Sources: New Constructs, LLC and company filings.
Companies in this sector have been significantly decreasing their Invested Capital in the past two years, perhaps as an acknowledgement of their previous overinvestment.
Energy
Figure 13: Weighted Average ROIC: Energy
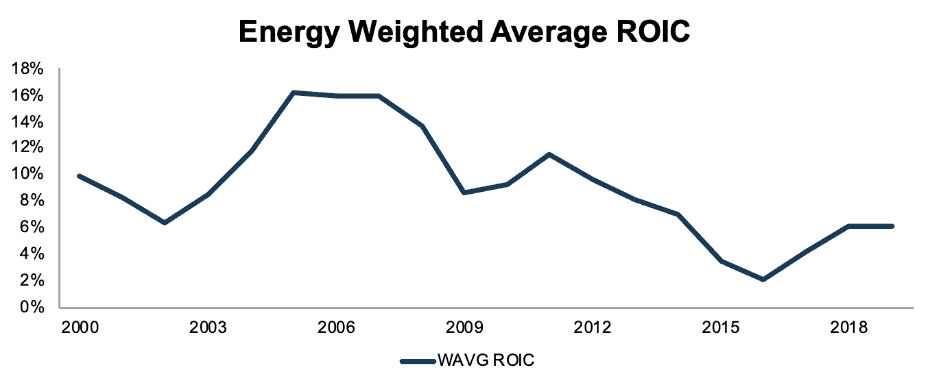
Sources: New Constructs, LLC and company filings.
The Energy sector hit its lowest ROIC this century in 2016 after the oil price rout, but profitability has rebounded nicely over the past two years. There’s been a wave of activists pushing Energy companies to tie executive compensation to Return on Capital Employed (ROCE), which has likely contributed to the strength of the rebound, along with rising oil prices.
Figure 14: NOPAT vs. Average Invested Capital: Energy
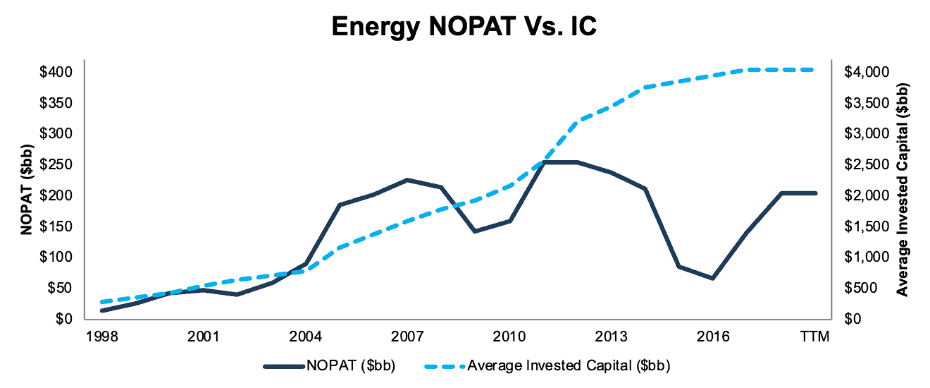
Sources: New Constructs, LLC and company filings.
Figure 14 backs up the idea that there’s been increased focus on capital discipline in the past two years as Invested Capital has levelled off after a dramatic rise in the previous decade.
Financials
Figure 15: Weighted Average ROIC: Financials
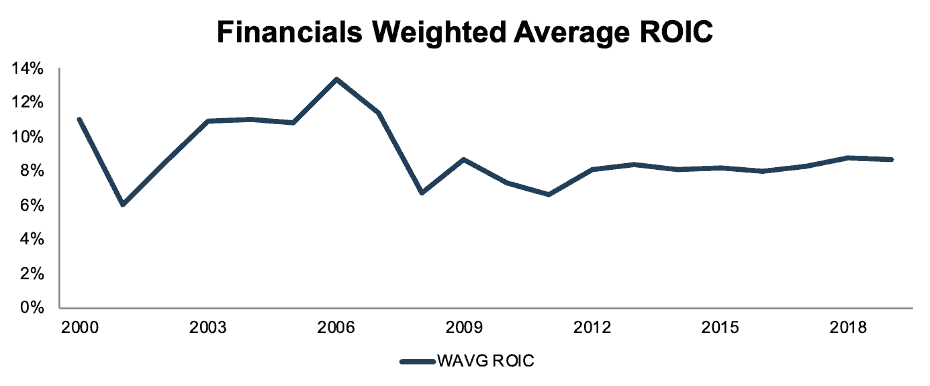
Sources: New Constructs, LLC and company filings.
After a great deal of volatility in the first decade of the 2000’s, the Financials sector has levelled off and maintained a steady 8-9% ROIC in recent years. Perhaps regulators have succeeded in their goal of making the sector more like Utilities.
Figure 16: NOPAT vs. Average Invested Capital: Financials
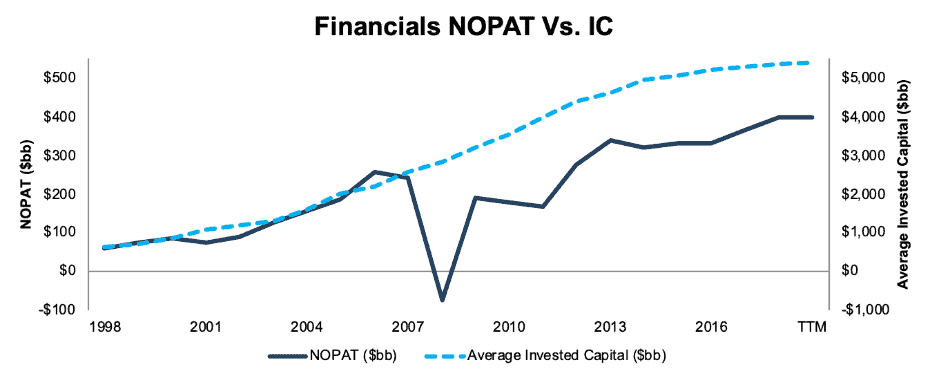
Sources: New Constructs, LLC and company filings.
Figure 16 also suggests that companies in the sector have responded to the lower but more stable ROIC by decreasing their rate of new investment.
Healthcare
Figure 17: Weighted Average ROIC: Healthcare
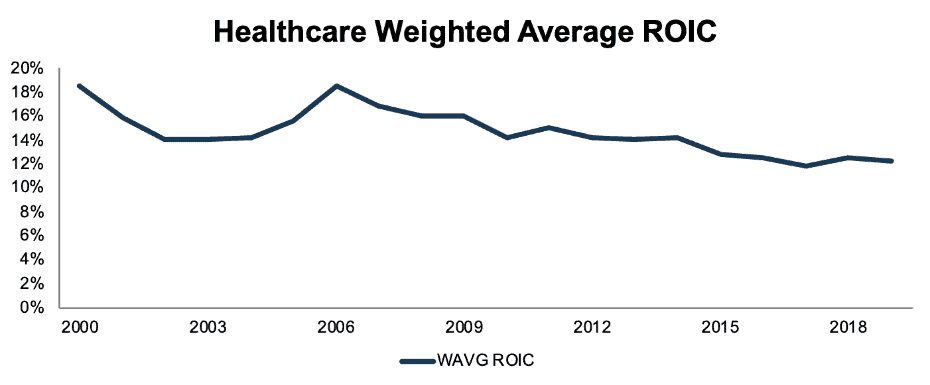
Sources: New Constructs, LLC and company filings.
While Healthcare remains a highly profitable sector with a 12% ROIC, its profitability has steadily declined over the past decade plus. The potential for more regulation in the sector and pricing pressure on drug companies suggests this trend could continue.
Figure 18: NOPAT vs. Average Invested Capital: Healthcare
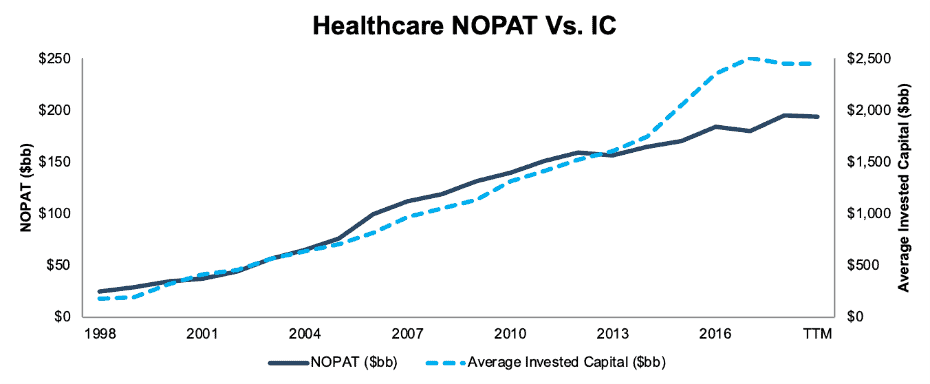
Sources: New Constructs, LLC and company filings.
Figure 18 shows that the decline in ROIC recently is driven more by a rapid increase in Invested Capital rather than a decline in NOPAT.
Industrials
Figure 19: Weighted Average ROIC: Industrials
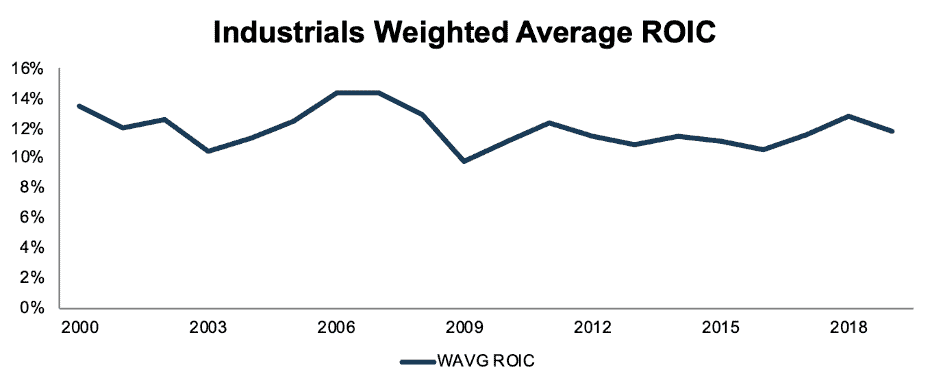
Sources: New Constructs, LLC and company filings.
As noted above, the Industrials sector has been both fairly stable and highly profitable since 2000, and there’s nothing to suggest that investors should expect this trend to change in the near future.
Figure 20: NOPAT vs. Average Invested Capital: Industrials
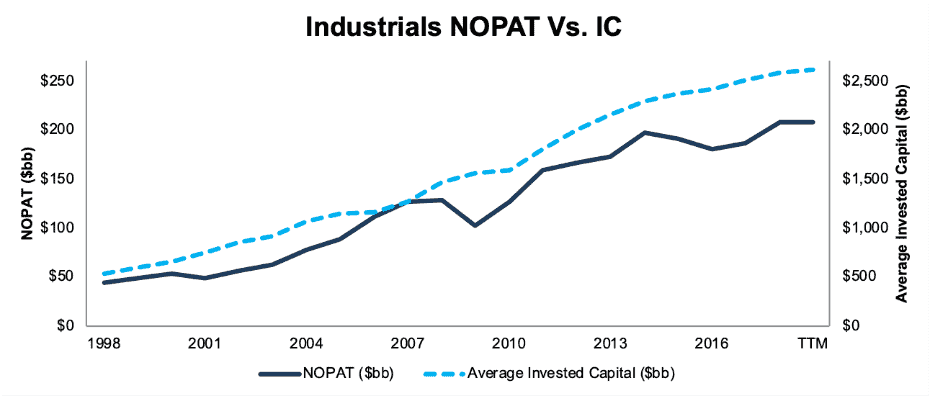
Sources: New Constructs, LLC and company filings.
Again, we don’t see any notable change here from the long-term trend of steady profitability.
Real Estate
Figure 21: Weighted Average ROIC: Real Estate
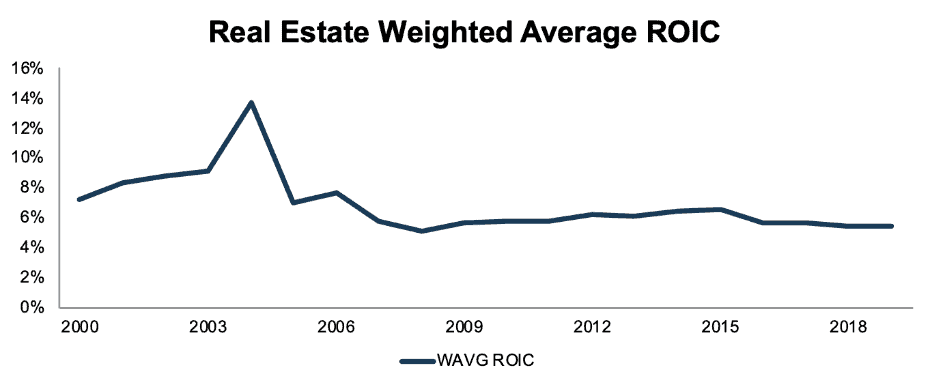
Sources: New Constructs, LLC and company filings.
Ever since the end of early 2000’s housing boom, Real Estate has been a consistently low ROIC sector, which is partly why it is our worst-rated sector overall.
Figure 22: NOPAT vs. Average Invested Capital: Real Estate
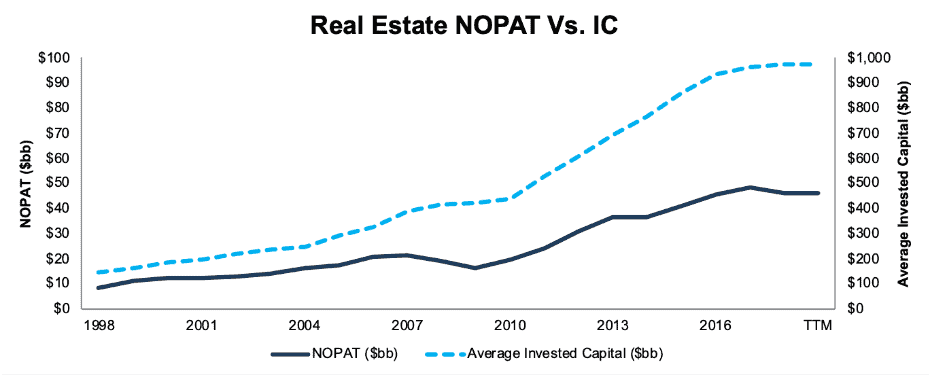
Sources: New Constructs, LLC and company filings.
Invested Capital in the Real Estate sector more than doubled between 2008-2018. It appears that companies in the sector anticipated an early 2000’s-like boom but have instead gotten a slower recovery.
Technology
Figure 23: Weighted Average ROIC: Technology
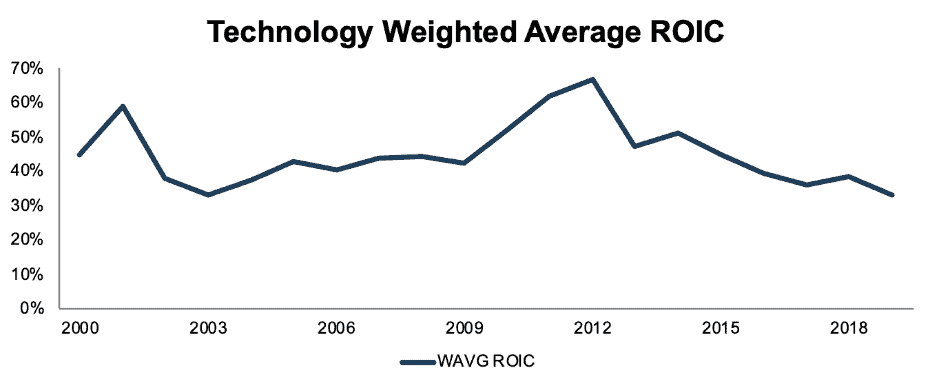
Sources: New Constructs, LLC and company filings.
A significant portion of the decline in weighted average ROIC for the Technology sector in recent years can be attributed to Apple, whose ROIC declined from 272% in 2012 to 106% TTM.
Figure 24: NOPAT vs. Average Invested Capital: Technology
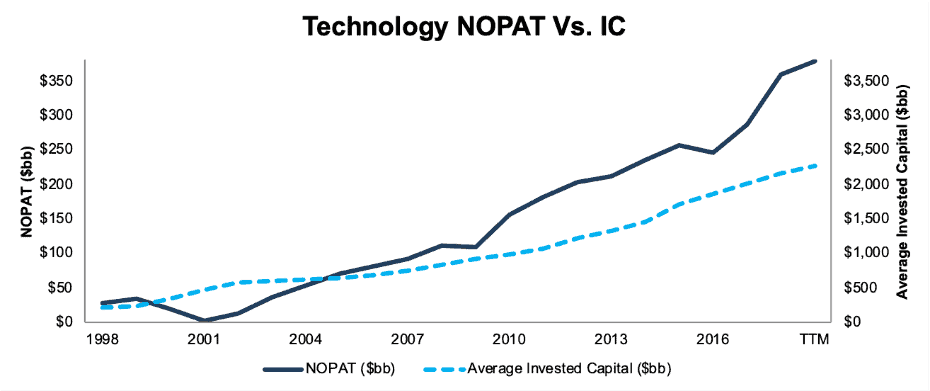
Sources: New Constructs, LLC and company filings.
Aggregate NOPAT and IC tell a more encouraging story. However, the dramatic rise in NOPAT in 2018 has still been highly concentrated in just a handful of big Technology companies.
Telecom
Figure 25: Weighted Average ROIC: Telecom
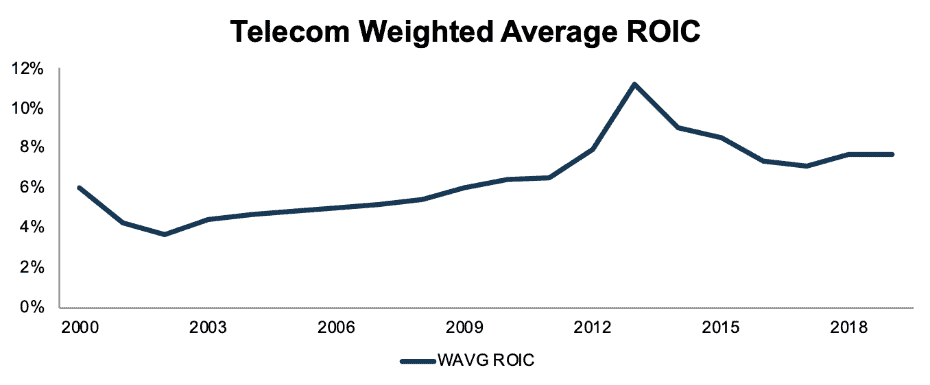
Sources: New Constructs, LLC and company filings.
Aside from an unusual blip in 2013, Telecom ROIC has been in a slow but steady uptrend since the early 2000’s.
Figure 26: NOPAT vs. Average Invested Capital: Telecom
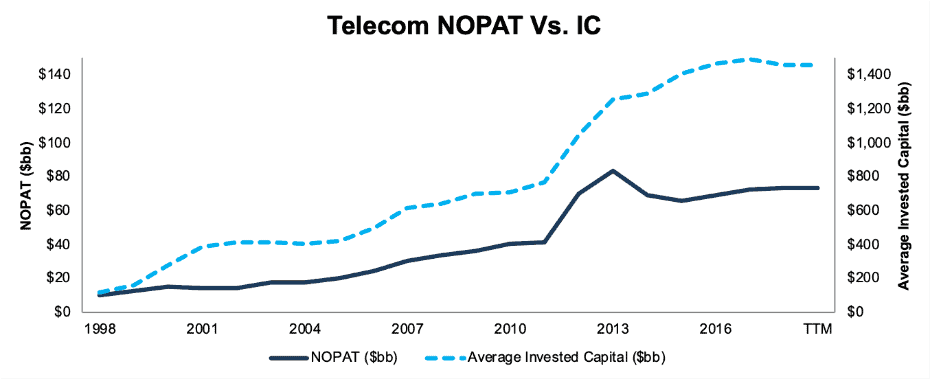
Sources: New Constructs, LLC and company filings.
Both NOPAT and Invested Capital have levelled out in recent years after the sharp spike in the early part of this decade.
Utilities
Figure 27: Weighted Average ROIC: Utilities
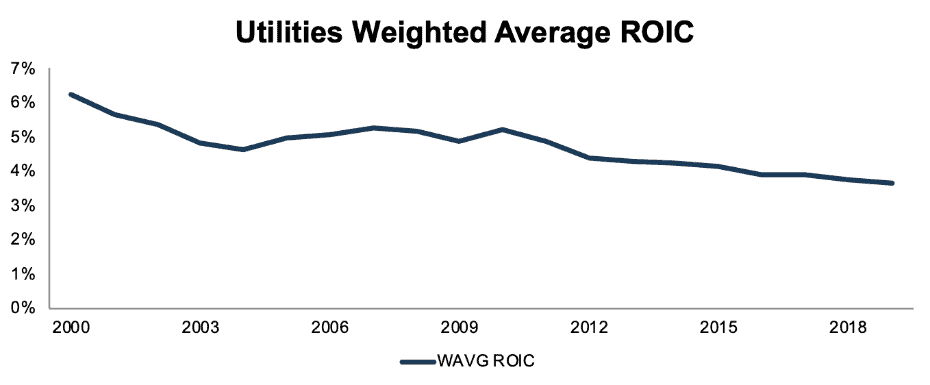
Sources: New Constructs, LLC and company filings.
ROIC has been in a steady decline in the Utilities sector for years. Some of this can likely be attributed to declining interest rates, but Figure 28 suggests there are other factors at work as well.
Figure 28: NOPAT vs. Average Invested Capital: Utilities
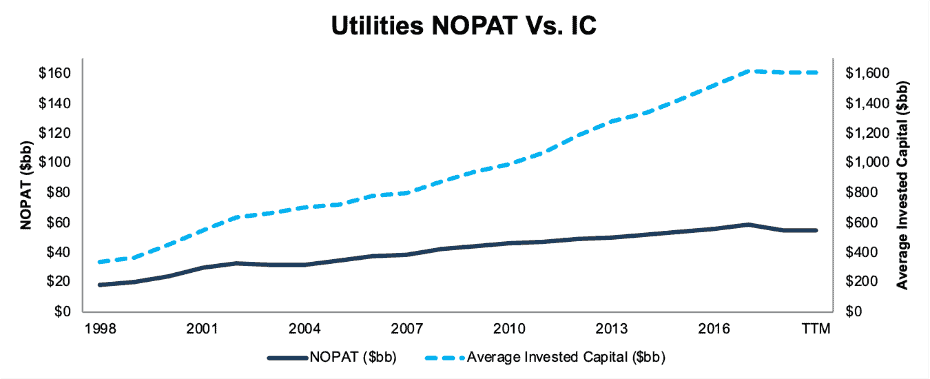
Sources: New Constructs, LLC and company filings.
Aggregate NOPAT actually declined in 2018, for the first time since 2003, despite rising interest rates. This decline in both NOPAT and ROIC suggests that structural issues, perhaps the rise of alternative energy sources, may be negatively impacting profitability in the sector.
To see our Sector ratings and reports, click here.
This article originally published on June 17, 2019.
Disclosure: David Trainer and Sam McBride receive no compensation to write about any specific stock, style, or theme.
Follow us on Twitter, Facebook, LinkedIn, and StockTwits for real-time alerts on all our research.
[1] This analysis includes every company we have a model for in a given year. We have an average of ~2,200 companies/year in this dataset.