The Mid Cap Blend style ranks seventh out of the twelve fund styles as detailed in our 1Q18 Style Ratings for ETFs and Mutual Funds report. Last quarter, the Mid Cap Blend style seventh as well. It gets our Neutral rating, which is based on an aggregation of ratings of 26 ETFs and 406 mutual funds in the Mid Cap Blend style as of January 22, 2018. See a recap of our 4Q17 Style Ratings here.
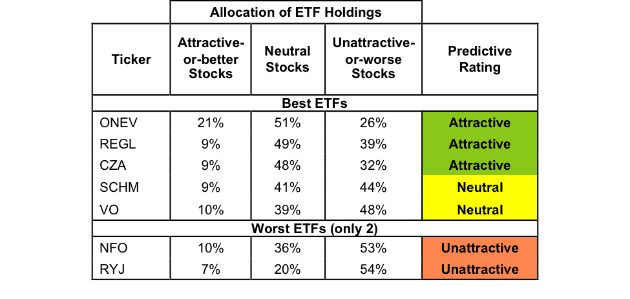
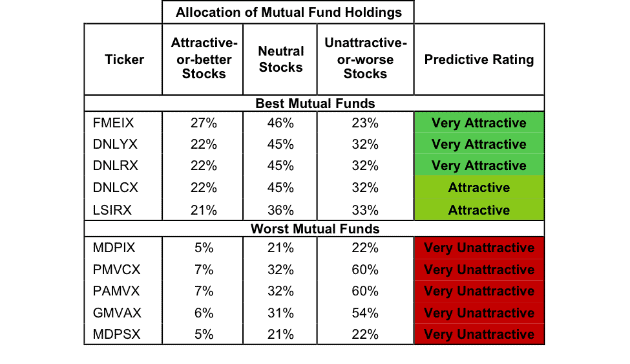
Figures 1 and 2 show the best and worst rated ETFs and mutual funds in the style. Not all Mid Cap Blend style ETFs and mutual funds are created the same. The number of holdings varies widely (from 20 to 2482). This variation creates drastically different investment implications and, therefore, ratings.
Investors seeking exposure to the Mid Cap Blend style should buy one of the Attractive-or-better rated ETFs or mutual funds from Figures 1 and 2.
Our Robo-Analyst technology empowers our unique ETF and mutual fund rating methodology, which leverages our rigorous analysis of each fund’s holdings.[1] We think advisors and investors focused on prudent investment decisions should include analysis of fund holdings in their research process for ETFs and mutual funds.
Figure 1: ETFs with the Best & Worst Ratings – Top 5
* Best ETFs exclude ETFs with TNAs less than $100 million for inadequate liquidity.
Sources: New Constructs, LLC and company filings
Six ETFs are excluded from Figure 1 because their total net assets (TNA) are below $100 million and do not meet our liquidity minimums.
Figure 2: Mutual Funds with the Best & Worst Ratings – Top 5
* Best mutual funds exclude funds with TNAs less than $100 million for inadequate liquidity.
Sources: New Constructs, LLC and company filings
Eleven mutual funds are excluded from Figure 2 because their total net assets (TNA) are below $100 million and do not meet our liquidity minimums.
State Street SPDR Russell 1000 Low Volatility Focus ETF (ONEV) is the top-rated Mid Cap Blend ETF and Fidelity Mid Cap Enhanced Index Fund (FMEIX) is the top-rated Mid Cap Blend mutual fund. ONEV earns an Attractive rating and FMEIX earns a Very Attractive rating.
Guggenheim Raymond James SB-1 Equity ETF (RYJ) is the worst rated Mid Cap Blend ETF and ProFunds Mid Cap ProFund (MDPSX) is the worst rated Mid Cap Blend mutual fund. RYJ earns an Unattractive rating and MDPSX earns a Very Unattractive rating.
The Danger Within
Buying a fund without analyzing its holdings is like buying a stock without analyzing its business and finances. Put another way, research on fund holdings is necessary due diligence because a fund’s performance is only as good as its holdings’ performance. Don’t just take our word for it, see what Barron’s says on this matter.
PERFORMANCE OF HOLDINGs = PERFORMANCE OF FUND
Analyzing each holding within funds is no small task. Our Robo-Analyst technology enables us to perform this diligence with scale and provide the research needed to fulfill the fiduciary duty of care. More of the biggest names in the financial industry (see At BlackRock, Machines Are Rising Over Managers to Pick Stocks) are now embracing technology to leverage machines in the investment research process. Technology may be the only solution to the dual mandate for research: cut costs and fulfill the fiduciary duty of care. Investors, clients, advisors and analysts deserve the latest in technology to get the diligence required to make prudent investment decisions.
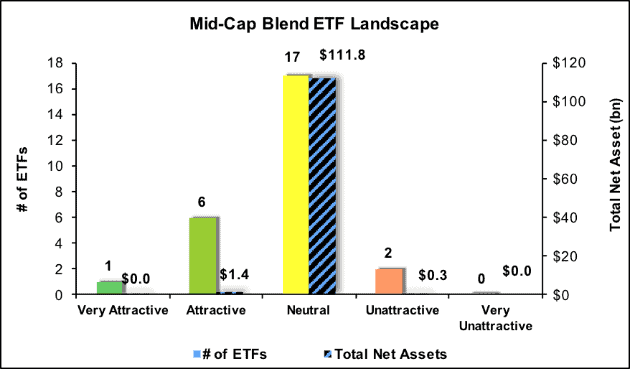
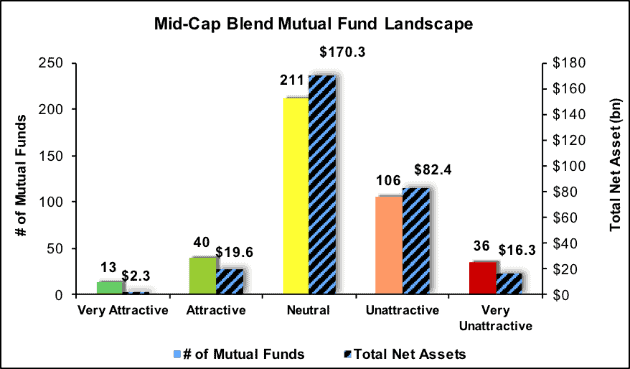
Figures 3 and 4 show the rating landscape of all Mid Cap Blend ETFs and mutual funds.
Figure 3: Separating the Best ETFs From the Worst Funds
Sources: New Constructs, LLC and company filings
Figure 4: Separating the Best Mutual Funds from the Worst Funds
Sources: New Constructs, LLC and company filings
This article originally published on January 22, 2018.
Disclosure: David Trainer, Kyle Guske II, and Peter Apockotos receive no compensation to write about any specific stock, style, or theme.
Follow us on Twitter, Facebook, LinkedIn, and StockTwits for real-time alerts on all our research.
[1] Ernst & Young’s recent white paper “Getting ROIC Right” proves the superiority of our holdings research and analytics.
Click here to download a PDF of this report.


