
With the subscriber loss in 1Q22 and guidance for further subscriber deterioration in 2Q22, the weaknesses in Netflix’s (NFLX: $240/share) business model are undeniable, as we’ve been pointing out for years. Even after falling 67% from its 52-week high, 56% from our report in April 2021 and 39% since our report in January 2022, we think the stock has much more downside.
Strong competition is taking market share, limiting pricing power, and making it clear that Netflix cannot generate anything close to the growth and profits implied by the current stock price.
First Subscriber Loss in Over 10 Years Should Not be a Surprise
Netflix lost 200,000 subscribers in 1Q22, which is well below its prior guidance for 2.5 million additions and is the company’s first subscriber loss in 10 years. More alarming, management guided for an additional loss of 2 million subscribers in 2Q22.
We expect subscriber contraction could be the norm moving forward, as noted in our January 2022 report because competition is taking meaningful market share and Netflix’s consistent price increases are clearly not well received in such a competitive market.
We expect Netflix will continue to lose market share as more competitors bolster their offerings and deep-pocketed peers such as Disney (DIS), Amazon (AMZN), and Apple (AAPL) continue to invest heavily in streaming.
Competitive Pressures Have Undermined Subscriber Growth For Years
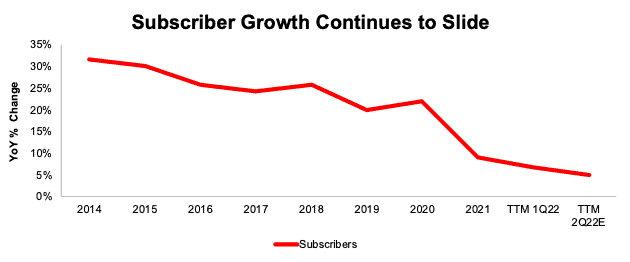
While Netflix plans to continue growing its content spending “relative to prior years”, it’s not clear that is a winning strategy to boost subscriber growth. Per Figure 1, Netflix’s subscriber growth has fallen from 31% YoY in 2014 to 7% YoY in the trailing twelve months ended in 1Q22.
Netflix’s guidance, which calls for a loss of 2 million subscribers, implies subscriber growth of just 5% YoY in the TTM ended 2Q22.
Figure 1: YoY Subscriber Growth Rate Since 2014
Sources: New Constructs, LLC and company filings.
Revenue Growth Follows a Similar Path
In its 1Q22 earnings press release, Netflix acknowledged “high household penetration, combined with competition, is creating revenue growth headwinds.” In addition, management noted “the big COVID boost to streaming obscured the picture until recently”. However, slowing revenue growth is nothing new.
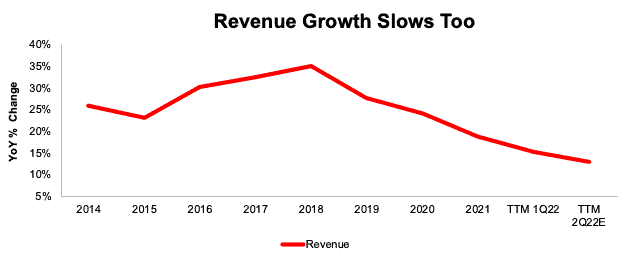
In fact, Netflix’s revenue growth has fallen from 26% YoY in 2014 to 15% YoY in the TTM ended 1Q22. Management’s guidance implies revenue growth falls even further, to just 13% YoY in the TTM ended 2Q22.
Figure 2: YoY Revenue Growth Rate Since 2014
Sources: New Constructs, LLC and company filings.
Ads to the Rescue? Or Just Worse User Experience
Netflix, and particularly co-founder and co-CEO Reed Hastings, have long been against an ad-supported Netflix. However, after the subscriber miss and weak guidance, that stance may be changing. On the 1Q22 earnings call, Hastings noted that an ad-supported plan would phase in over a couple of years, while stressing that consumers would still be able to choose an ad-free service.
While an ad-supported service may help the business grow the top-line, consumers largely don’t enjoy ad-supported streaming platforms. An October 2021 survey by Morning Consult found of U.S adults:
- 44% said there are too many ads on streaming services
- 64% said targeted ads are invasive
- 69% think ads on streaming services are repetitive
- 79% are bothered by the experience
Time will tell if consumers flock to an ad-supported Netflix, but the data indicates it would instantly create a worse experience.
Top-Line and Subscriber Growth Aren’t the Only Issues
Netflix faces a litany of challenges to turn its cash-burning business into a cash earner and justify the expectations baked into its stock price. Below we present a brief summary of those challenges. You can get more in-depth details in our January 2022 report.
Netflix’s First Mover Advantage Is Gone
The streaming market is now home to at least 15 services with more than 10 million subscribers, and many of these competitors, such as Disney, Amazon, YouTube (GOOGL), Apple, Paramount (PARA) and HBO Max (WBD) have at least one of two key advantages:
- profitable businesses that subsidize lower-cost streaming offerings
- a deep catalog of content that is owned by the company, rather than licensed from others
Harder to Hike Prices With So Many Low-Cost Alternatives
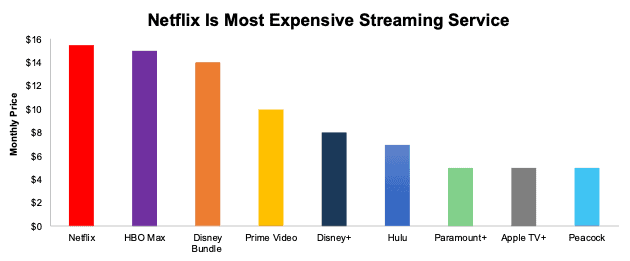
We underestimated Netflix’s ability to raise prices before, but now that competition is flooding the market, our thesis is playing out as expected. Netflix’s projection for subscriber losses in 2Q22 indicates that its recent price hike, amidst a landscape of so many lower-priced alternatives, may have reached a ceiling for how much consumers will pay. Per Figure 3, Netflix now charges more than every other major streaming service. For reference, we use Netflix’s “Standard” plan and the equivalent packages from competitors in Figure 3.
Figure 3: Monthly Price for Streaming Services in the U.S.
Sources: New Constructs, LLC
Can’t Have Growth and Cash Flows
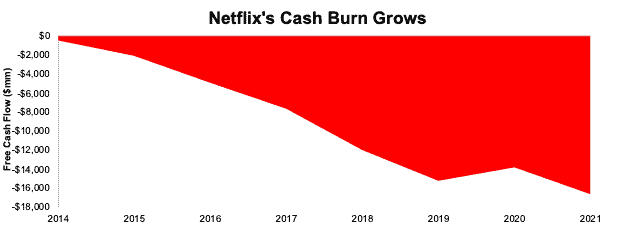
After positive FCF in 2020, Netflix returned to its cash-burning ways, and generated -$2.8 billion in FCF in 2021. Since 2014, Netflix has burned through $16.6 billion in FCF. See Figure 4.
Figure 4: Netflix’s Cumulative Free Cash Flow Since 2014
Sources: New Constructs, LLC and company filings.
Heavy cash burn is likely to continue given that Netflix has one revenue stream, subscriber fees, while competitors such as Disney monetize content across theme parks, merchandise, cruises, and more. Competitors such as Apple, and Comcast/NBC Universal (CMCSA) generate cash flows from other businesses that can help fund content production and lower margins on streaming offerings.
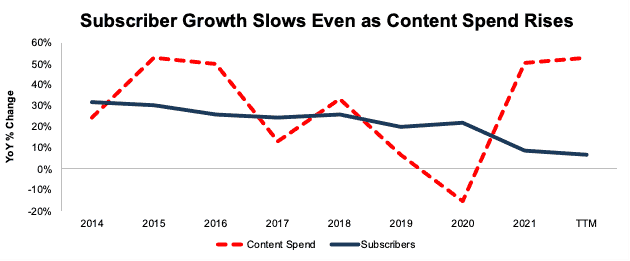
Huge Red Flag – Subscriber Growth Fell Despite Content Spend Rising
Netflix’s free cash flow was positive in 2020 for the first time since 2010. But positive FCF comes almost entirely from Netflix cutting content spending during the COVID-19 pandemic. Netflix cannot generate positive FCF and increase content spending.
In the past, we saw a strong relationship between content spend and subscriber growth. So, the spend seemed worth it. As of yesterday’s earnings release, we’re seeing that relationship break down.
Per Figure 5, even after significantly increasing content spend in 2021 and over the TTM, Netflix’s subscriber growth continued to fall YoY. Considering the hyper-competitive, content driven nature of the streaming business, a lack of subscriber growth is a huge red flag. Throwing billions of dollars at content will not be enough to fend off competition, and even when spending heavily on content, new subscribers aren’t showing up.
Figure 5: Change in Subscriber Growth & Content Spend: 2014 – TTM
Sources: New Constructs, LLC and company filings.
Lack of Live Content Limits Subscriber Growth
Netflix has historically stayed out of the live sports arena, a stance that looks unlikely to change. Co-CEO Reed Hastings stated in mid 2021 Netflix would require exclusivity that is not offered by sport leagues in order to “offer our customers a safe deal.” For consumers that require live content as part of their streaming needs, Netflix is either not an option, or must be purchased as a complementary service with a competitor.
Meanwhile, Disney, Amazon, CBS, NBC, and Fox (each of which has its own streaming platform) are securing rights to more and more live content, especially the NFL and NHL, giving them a very popular offering that Netflix cannot match. More recently, Apple began broadcasting Friday Night Baseball and it’s reported that Apple is nearing a deal for NFL Sunday Ticket, which would only bolster its live offerings
Netflix’s Current Valuation Implies Subscribers Will Double
We use our reverse discounted cash flow (DCF) model and find that the expectations for Netflix’s future cash flows look overly optimistic given the competitive challenges above and guidance for further slowing in user growth. To justify Netflix’s current stock price of ~$240/share, the company must:
- maintain its 5-year average NOPAT margin of 12% [1] and
- grow revenue 13% compounded annually through 2027, which assumes revenue grows at consensus estimates in 2022-2023 and 12% each year thereafter (equal to 2022 revenue estimates)
In this scenario, Netflix’s implied revenue in 2027 of $59.5 billion is 4.4x the TTM revenue of Fox Corp (FOXA), 2.1x the TTM revenue of Paramount Global, 1.5x the combined TTM revenue of Paramount Global and Warner Bros. Discovery (WBD) and 82% of Disney’s TTM revenue.
To generate this level of revenue and reach the expectations implied by its stock price, Netflix would need:
- 335 million subscribers at an average monthly price of $14.78/subscriber
- 424 million subscribers at an average monthly price of $11.67/subscriber
$14.78 is the average monthly revenue per membership in the United States and Canada in 1Q22. However, the majority of Netflix’s subscriber growth comes from international markets, which generate much less per subscriber. The overall (U.S. and international) average monthly revenue per subscriber was $11.67 in 2021. At that price, Netflix needs to nearly double its subscriber base to over 424 million to justify its stock price.
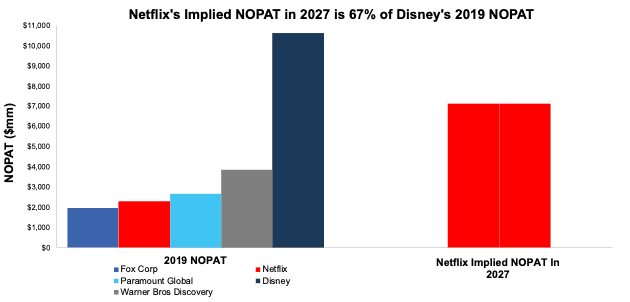
Netflix’s implied NOPAT in this scenario is $7.1 billion in 2027, which would be 3.6x the 2019 (pre-pandemic) NOPAT of Fox Corp, 1.9x the 2019 NOPAT of Paramount Global, 1.1x the combined 2019 NOPAT of Paramount Global and Warner Bros. Discovery, and 67% of Disney’s 2019 NOPAT.
Figure 6 compares Netflix’s implied NOPAT in 2027 with the 2019 NOPAT[2] of other content production firms.
Figure 6: Netflix’s 2019 NOPAT and Implied 2027 NOPAT vs. Content Producers
Sources: New Constructs, LLC and company filings.
There’s 50% Downside if Margins Fall to Streaming History Average
Should Netflix’s margins fall even further given competitive pressures, more spending on content creation, and/or subscriber acquisition, the downside is even greater. Specifically, if we assume:
- Netflix’s NOPAT margin falls to 9% (equal to average since 2014) and
- Netflix grows revenue by 10% compounded annually through 2027, (equal to management’s guided YoY revenue growth rate for 2Q22) then
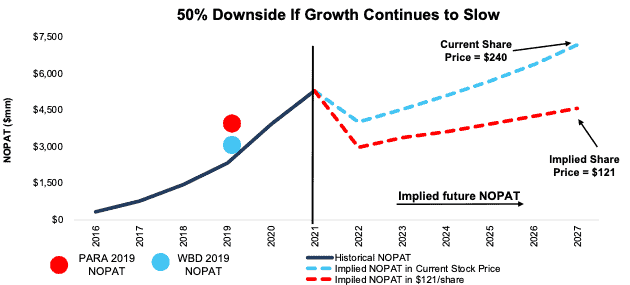
the stock is worth just $121/share today – a 50% downside. In this scenario, Netflix’s revenue in 2027 would be $51.3 billion, which implies Netflix has 289 million subscribers at the current U.S. and Canada average monthly price or 367 million subscribers at the overall average revenue per subscriber of $11.67/month. For reference, Netflix’s had 222 million subscribers at the end of 1Q22.
In this scenario, Netflix’s implied revenue of $51.3.0 billion is 3.8x the TTM revenue of Fox Corp, 1.8x the TTM revenue of Paramount Global, 1.3x the combined TTM revenue of Paramount Global and Warner Bros Discovery and 70% of Disney’s TTM revenue.
Netflix’s implied NOPAT in this scenario would be 2.3x the 2019 (pre-pandemic) NOPAT of Fox Corp, 1.2x the 2019 NOPAT of Paramount Global, 70% the combined 2019 NOPAT of Paramount Global and Warner Bros Discovery, and 43% of Disney’s 2019 NOPAT.
Figure 7 compares the firm’s historical revenue and implied NOPAT for the scenarios above to illustrate the expectations baked into Netflix’s stock price. For reference, we also include the pre-pandemic NOPAT of Paramount Global and Warner Bros Discovery.
Figure 7: Netflix’s Historical NOPAT vs. DCF Implied NOPAT
Sources: New Constructs, LLC and company filings
Maybe Too Optimistic
The above scenarios assume Netflix’s YoY change in invested capital is 14% of revenue (half of 2021) in each year of our DCF model. For context, Netflix’s invested capital has grown 40% compounded annually since 2014 and change in invested capital has averaged 26% of revenue each year since 2014.
It is more likely that spending will need to be much higher to achieve the growth in the above forecasts, but we use this lower assumption to underscore the risk in this stock’s valuation.
This article originally published on April 20, 2022.
Disclosure: David Trainer, Kyle Guske II, and Matt Shuler receive no compensation to write about any specific stock, style, or theme.
Follow us on Twitter, Facebook, LinkedIn, and StockTwits for real-time alerts on all our research.
[1] Assumes NOPAT margin falls to be closer with historical margins as costs increase from pandemic lows. For example, Netflix projects operating margin between 19-20% in 2022, down from 21% in 2021.
[2] We use 2019 NOPAT in this analysis to analyze the pre-COVID-19 profitability of each firm, given the pandemic’s impact on the global economy in 2020 and 2021 and the other business segments of these peers.