Five new stocks make our Dividend Growth Stocks Model Portfolio this month, which was made available to members on July 28, 2017.
Recap from June’s Picks
Our Dividend Growth Stocks Model Portfolio underperformed the S&P 500 last month. The Model Portfolio rose 0.4% on a price return basis and 0.7% on a total return basis. The S&P 500 rose 2.2% on a price and total return basis. The portfolio’s best performing stock was Scripps Networks Interactive (SNI), which was up 27%. Overall, 8 out of the 30 Dividend Growth Stocks outperformed the S&P during the 6/30/17 to 7/27/17 measurement period, which marked this portfolio’s first measurement period since inception.
The long-term success of our model portfolio strategies highlights the value of our Robo-Analyst technology, which scales our forensic accounting expertise (featured in Barron’s) across thousands of stocks.
The methodology for this model portfolio mimics an All-Cap Blend style with a focus on dividend growth. Selected stocks earn an Attractive or Very Attractive rating, generate positive free cash flow (FCF) and economic earnings, offer a current dividend yield >1%, and have a 5+ year track record of consistent dividend growth. This model portfolio is designed for investors who are more focused on long-term capital appreciation than current income, but still appreciate the power of dividends, especially growing dividends.
New Stock Feature for July: Lennox International (LII: $173/share)
Lennox International (LII) is one of the additions to our Dividend Growth Stocks Model Portfolio in July. LII is an industrial goods manufacturer that designs and builds climate control systems for the residential building, commercial building, and refrigeration markets.
Per Figure 1, LII’s trailing twelve months (TTM) revenue has just recently eclipsed the prior peak in 2007, which results in compound annual revenue growth of just 0.3% over the past decade. After-tax profits (NOPAT), however, grew 9% compounded annually over the same 10-year period due to an improvement in NOPAT margin from 4% in 2006 to 10% TTM. Over the past five years, revenue growth has improved to 6% compounded annually, which has allowed NOPAT growth to accelerate to 19% compounded annually. LII’s current return on invested capital (ROIC) of 16% is in the top-quintile of our coverage. It is much improved from the 9% earned in 2012 and 2007.
Figure 1: LII’s Favorable Revenue and NOPAT Margin Trajectory
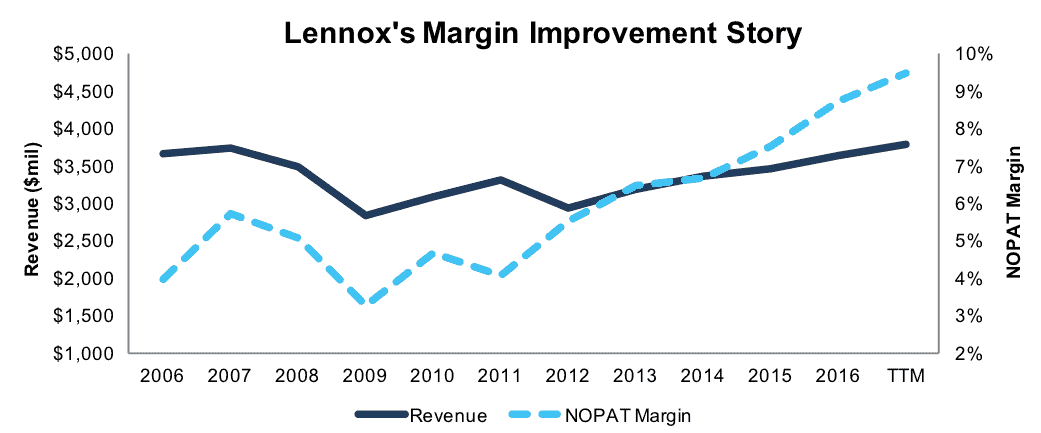
Sources: New Constructs, LLC and company filings
Free Cash Flow Supports Dividend Growth
LII’s current annualized dividend of $2.04/share equates to 17% compound annual growth compared to $0.92 paid in 2012. LII has increased its dividend for seven consecutive years and nine out of the last ten years. Dividend growth has been enabled by LII’s growing NOPAT and healthy free cash flow. Both of these trends also point to future dividend growth potential.
Since 2012, LII has generated cumulative FCF of $1 billion (13% of market cap) and paid out cumulative dividends of approximately $350 million. LII’s $318 million in FCF over the trailing twelve months represents 370% of the cash dividend payment based on a $2.04/share annual dividend. Stated differently, LII’s current annual dividend equates to a 27% FCF payout ratio.
Companies with FCF well in excess of dividend payments provide higher quality dividend growth opportunities because we know the firm generates the cash to support the current dividend as well as a higher dividend. On the flip side, the dividend growth trajectory of a company where FCF falls short of the dividend payment over time cannot be trusted to grow or sustain its dividend because of inadequate free cash flow.
Figure 2: After-Tax Profits (NOPAT) and Free Cash Flow (FCF) vs. Dividend Payments
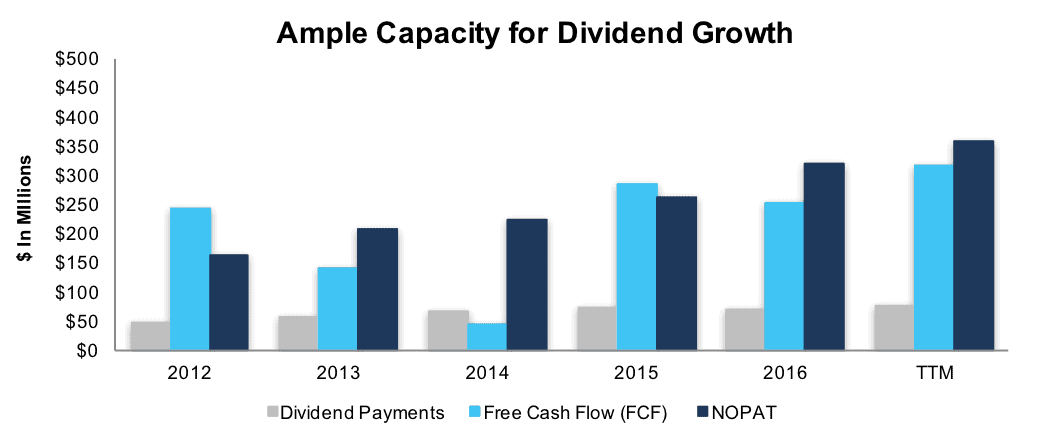
Sources: New Constructs, LLC and company filings
Textbook Dividend Growth Stock with Attractive Risk-Reward
At its current price of $173/share, LII has a has a price-to-economic book value (PEBV) ratio of 1.3. This ratio means the market expects LII’s NOPAT to increase no more than 30% over the remainder of its corporate life. This expectation seems overly conservative for a firm that has grown NOPAT 9% compounded annually over the past ten years and 19% compounded annually over the past five years.
If LII can maintain current NOPAT margins (10% TTM) and grow NOPAT by 6% compounded annually over the next decade, the stock is worth $210/share today – a 21% upside. In a more optimistic scenario of 8% compound annual NOPAT growth over the next decade, the stock is worth $240/share today – a 39% upside.
Based on our methodology, LII represents an attractive risk-reward opportunity for investors and a textbook addition to our Dividend Growth Stocks Model Portfolio due to: meaningful upside potential rooted in reasonable expectations, rapidly growing dividends, and a low ratio of FCF/dividend payments.
Impacts of Footnotes Adjustments and Forensic Accounting
Our Robo-Analyst technology enables us to perform forensic accounting with scale and provide the research needed to fulfill fiduciary duties. In order to derive the true recurring cash flows, an accurate invested capital, and a real shareholder value, we made the following adjustments to Lennox International’s 2016 10-K:
Income Statement: we made $176 million of adjustments with a net effect of removing $41 million in non-operating expense (1% of revenue). We removed $108 million related to non-operating expenses and $68 million related to non-operating income. See all adjustments made to LII’s income statement here.
Balance Sheet: we made $1.5 billion of adjustments to calculate invested capital with a net increase of $1 billion. The most notable adjustment was $521 million (60% of reported net assets) related to asset write-downs. See all adjustments to LII’s balance sheet here.
Valuation: we made $1.5 billion of adjustments with a net effect of decreasing shareholder value by $1.5 billion. There were no adjustments that increased shareholder value. The largest adjustment to shareholder value was $1.3 billion for total debt, which includes $139 million of off-balance sheet operating leases. This debt adjustment represents 18% of LII’s market value.
This article originally published on August 8, 2017.
Disclosure: David Trainer, Kenneth James, and Kyle Guske II receive no compensation to write about any specific stock, style, or theme.
Follow us on Twitter, Facebook, LinkedIn, and StockTwits for real-time alerts on all our research.