Twelve new stocks make our Safest Dividend Yields Model Portfolio this month, which was made available to members on 2/22/17.
Recap from January’s Picks
Our Safest Dividend Yields Model Portfolio (+1.9%) underperformed the S&P 500 (+4.1%) last month. The best performing stocks in the portfolio were large cap stock Cisco Systems (CSCO), which was up 13%, and small cap stock, Highway Holdings (HIHO), which was up 9%. Overall, eight out of the 20 Safest Dividend Yields stocks outperformed the S&P in January and 14 had positive returns.
The success of the Safest Dividend Yields Model Portfolio highlights the value of our forensic accounting research (featured in Barron’s). Companies with strong free cash flow provide higher quality and safer dividend yields because we know they have the cash to support the dividend. By analyzing footnotes in SEC filings, we are able to calculate cash flow more accurately and diligently.
This Model Portfolio only includes stocks that earn an Attractive or Very Attractive rating, have positive free cash flow and economic earnings, and offer a dividend yield greater than 3%. We think this combination provides a uniquely well-screened group of stocks that can deliver returns greater than the market.
New Stock Feature for February: General Motors (GM: $37/share)
General Motors (GM) is one of the additions to our Safest Dividend Yields Model Portfolio in February. We featured General Motors in September 2015 when we highlighted its impressive profit growth and undervalued stock price. Since then, GM has traded in line with the S&P 500 (both are up 20%), and it remains undervalued.
Since 2012, General Motors has grown after tax profit (NOPAT) by 23% compounded annually. NOPAT margins have improved from 3% in 2012 to 5% in 2016, per Figure 1. General Motors’ return on invested capital (ROIC) has improved from 6% in 2012 to 13% in 2016. Such strong fundamentals and a 4% dividend yield earn GM a spot on this month’s Safest Dividend Yields Model Portfolio.
Figure 1: General Motors’ Improving Profitability 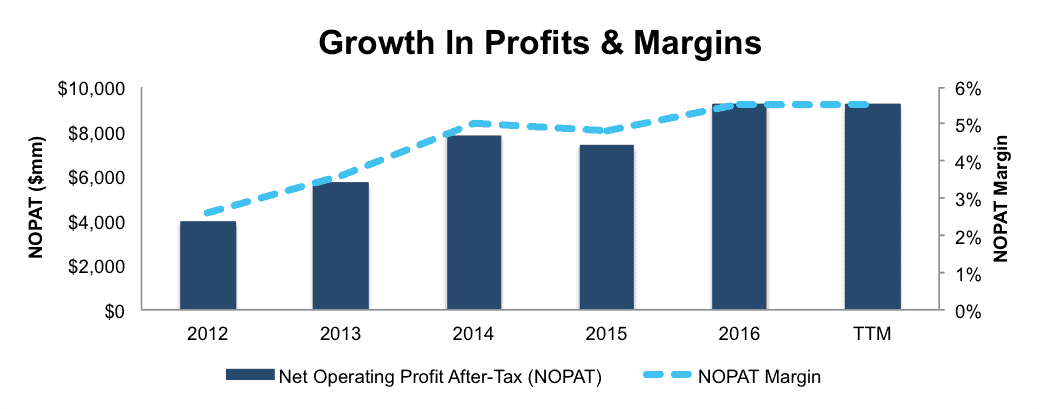 Sources: New Constructs, LLC and company filings
Free Cash Flow Supports Dividend Payments
General Motors has increased its dividend payment from $0.30/quarter in 2014 to $0.38/quarter in 2016, per Figure 2. The increase in dividend payment is made possible by GM’s positive free cash flow (FCF). Over the past five years, General Motors has generated a cumulative $32 billion in FCF (58% of market cap).
Companies with strong free cash flow provide higher quality dividend yields because we know the firm has the cash to support its dividend. On the flip side, dividends from companies with low or negative free cash flow cannot be trusted as much because the company may not be able to sustain paying dividends.
Figure 2: Increasing Dividend Payment Since 2014 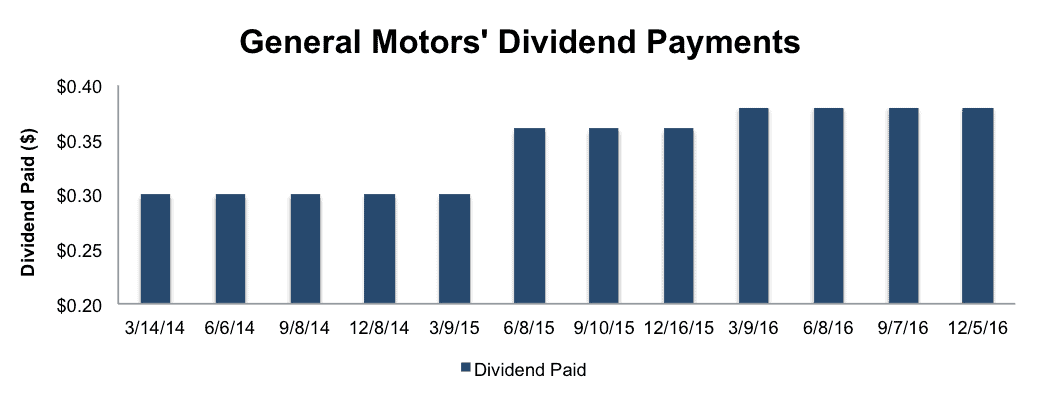 Sources: New Constructs, LLC and company filings
Despite Strong Fundamentals, GM Remains Undervalued
Despite General Motors’ share price increasing 45% over the past five years, shares remain undervalued. At its current price of $37/share, GM has a price-to-economic book value (PEBV) ratio of 0.4. This ratio means the market expects GM’s NOPAT to permanently decline by 60% from current levels. Such expectations seem overly pessimistic for a firm that has grown NOPAT by 23% compounded annually since 2012.
Even if GM were to never again grow profits from current levels, the economic book value, or no growth value of the firm is $93/share – a 150% upside from the current valuation.
If General Motors can grow NOPAT by just 2% compounded annually for the next five years, the stock is worth $96/share today – a 160% upside. Large upside potential coupled with GM’s 4% dividend yield provide investors a great low risk/high reward opportunity.
Impacts of Footnotes Adjustments and Forensic Accounting
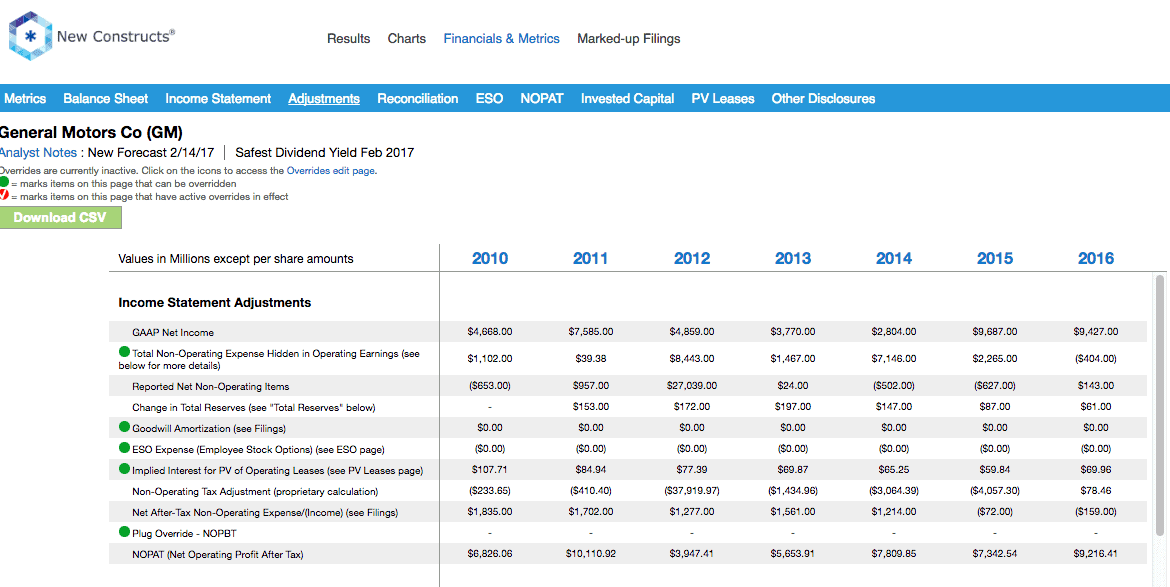
In order to derive the true recurring cash flows, an accurate invested capital, and a real shareholder value, we made the following adjustments to General Motors’ 2016 10-K:
Income Statement: we made $10 billion of adjustments with a net effect of removing $211 million in non-operating income (<1% of revenue). We removed $4.9 billion related to non-operating expenses and $5.1 billion related to non-operating income. See all adjustments made to GE’s income statement here.
Balance Sheet: we made $92 billion of adjustments to calculate invested capital with a net decrease of $18 billion. The most notable adjustment was $35 billion (39% of reported net assets) related to deferred tax assets. See all adjustments to GM’s balance sheet here.
Valuation: we made $54 billion of adjustments with a net effect of decreasing shareholder value by $21 billion. The largest adjustment to shareholder value was $24 billion in underfunded pensions. This adjustment represents 44% of GM’s market value. Despite the decrease in shareholder value, GM remains undervalued.
This article originally published here on March 2, 2017.
Disclosure: David Trainer, Kyle Martone, and Kyle Guske II receive no compensation to write about any specific stock, style, or theme.
Follow us on Twitter, Facebook, LinkedIn, and StockTwits for real-time alerts on all our research.
Scottrade clients get a Free Gold Membership ($588/yr value) as well as 50% discounts and up to 20 free trades ($140 value) for signing up to Platinum, Pro or Unlimited memberships. Login or open your Scottrade account & find us under Quotes & Research/Investor Tools.