
Operating Earnings calculated by S&P Global (SPGI) for the S&P 500 overstate Core Earnings[1] through 1Q22. GAAP Earnings are similarly misleading, as detailed here.
Stocks are more expensive than they appear based on SPGI’s Operating Earnings. Despite falling ~13% in 2022, the S&P 500’s current valuation requires more earnings growth than analysts expect, even after many companies’ weakening guidance for 2Q22 and the rest of the year. Last quarter’s analysis of Core vs. Operating Earnings for the S&P 500 is here.
This report leverages our cutting-edge Robo-Analyst technology to deliver proven-superior[2] fundamental research and support more cost-effective fulfillment of the fiduciary duty of care.
S&P Global’s Earnings Rebound Is Overstated
In 2021, S&P 500 company profits did not rebound as much as SPGI’s Operating Earnings lead investors to believe. For 2021 versus 2020:
- SPGI’s Operating Earnings improved from $122.37/share to $208.21/share, or 70%
- Core Earnings improved from $120.05/share to $197.10/share, just 64%
In 1Q22, Operating Earnings are still 5% higher than Core Earnings even though Core Earnings improved at a faster pace, rising 47% YoY, compared to Operating Earnings, which rose 40%.
Figure 1: Trailing Twelve Month Earnings: Core Earnings vs. SPGI Operating Earnings: 4Q19 –1Q22
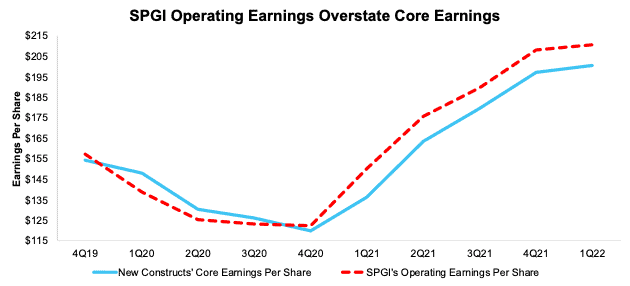
Sources: New Constructs, LLC, company filings, and S&P Global (SPGI). Note: the most recent period’s data for SPGI’s Operating Earnings is based on consensus estimates for companies with a non-standard fiscal year.
More details on the Core Earnings calculation are available in Appendix I.
SPGI’s Operating Earnings do not exclude the unusual expenses that exaggerated the decline in 2020 and subsequent reversal in 2021.
S&P 500 Is More Expensive than Operating Earnings Imply
At the end of 1Q22, Core Earnings for the S&P 500 reached new highs, surpassing previous records set in each of the past three TTM periods ended 2021, 3Q21, and 2Q21. The bear market that began in 2022 has closed the gap between the S&P 500’s valuation and its true fundamentals, but not as much as either GAAP earnings or SPGI’s Operating Earnings would have you believe.
Figure 2: Price-to-Core vs. Price-to-SPGI’s Operating Earnings: TTM as of 12/31/15 – 5/16/22
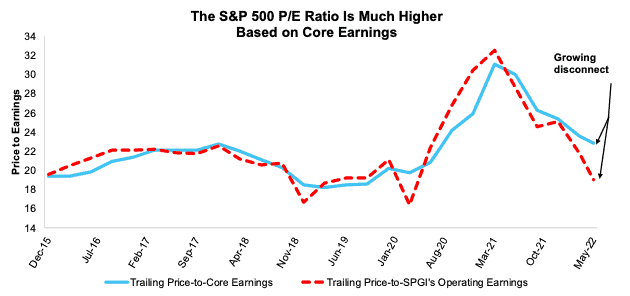
Sources: New Constructs, LLC, company filings, and S&P Global. Note: the most recent period’s data for SPGI’s Operating Earnings incorporates consensus estimates for companies with a non-standard fiscal year.Our Core Earnings P/E ratio is aggregating the TTM results for constituents through 6/30/13 and aggregating four quarters of results for the S&P 500 constituents in each measurement period thereafter. SPGI’s P/E is based on four quarters of aggregated S&P 500 results in each period. More details in Appendix II.
As Operating Earnings continue to overstate the S&P 500’s Core Earnings, the index requires growing investor optimism about future profits just to maintain valuations and stop price declines. Using overstated earnings leads investors to understate risk, a fact that has been on grotesque display in equity markets recently. Based on warnings from companies willing to face reality, and the disconnect between Core Earnings and Operating Earnings, investors can expect more companies warning about slowing earnings growth or even outright decline in coming quarters.
Figure 2 shows the S&P 500 trailing P/E ratios based on Core Earnings and SPGI’s Operating Earnings have fallen significantly from their peaks in March 2021. Prices have come down relative to earnings since valuations peaked in 2021, but the faster rebound in SPGI’s Operating Earnings results in a lower P/E ratio based on Operating Earnings (19.0) than when using Core Earnings (22.9). The S&P 500 looks inexpensive when valued using Operating Earnings, but that is not the case when the more accurate Core Earnings measure is used.
Core Earnings are Less Volatile and More Reliable
Figure 3 highlights the percentage changes in Core Earnings and SPGI’s Operating Earnings from 2004 to present (through 5/16/22). The difference between the measures is driven by flaws in legacy datasets (detailed in The Journal of Financial Economics) that lead to a failure to capture unusual gains/losses buried in footnotes.
Figure 3: Core vs. SPGI’s Operating Earnings per Share for the S&P 500 – % Change: 2004 – 5/16/22
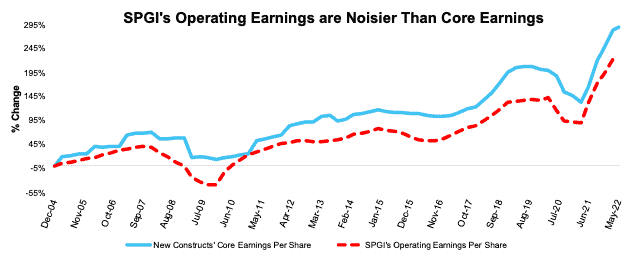
Sources: New Constructs, LLC, company filings, and S&P Global (SPGI). Note: the most recent period’s data for SPGI’s Operating Earnings incorporates consensus estimates for companies with a non-standard fiscal year.Our Core Earnings analysis is based on aggregated TTM data through 6/30/13, and aggregated quarterly data thereafter for the S&P 500 constituents in each measurement period.
An Example of Overstated Earnings in the S&P 500: Tesla Inc. (TSLA)
Below, we detail the hidden and reported unusual items that GAAP Earnings misses but that are captured in Core Earnings for Tesla Inc. (TSLA), a stock with some of the most overstated GAAP earnings in the S&P 500. We would be happy to reconcile our Core Earnings with Operating Earnings if S&P Global would disclose exactly how Operating Earnings differ from GAAP Earnings.
After adjusting for unusual items, we find that Tesla’s Core Earnings of $6.2 billion, or $5.46/share are much worse than reported GAAP Earnings of $8.4 billion, or $7.40/share. Tesla’s Earnings Distortion Score is Strong Miss. See all our research on Tesla here.
Below, we detail the differences between Core Earnings and GAAP Earnings so readers can audit our research.
Figure 4: Tesla GAAP Earnings to Core Earnings Reconciliation: TTM Through 1Q22

Sources: New Constructs, LLC and company filings.
More details:
Total Earnings Distortion of $1.94/share, which equals $2.2 billion, is comprised of the following:
Hidden Unusual Gains, Net = $0.73/per share, which equals $823 million and is comprised of
- $947 million in automotive regulatory credits in the TTM period based on
- $314 million in 4Q21
- $279 million in 3Q21
- $354 million in 2Q21
- -$124 million in inventory and purchase commitment write-downs in the TTM period based on
- -$33 million in 1Q22
- -$12 million in 4Q21
- -$40 million in 3Q21
- -$39 million in 2Q21
Reported Unusual Gains Pre-Tax, Net = $0.68/per share, which equals $768 million and is comprised of
- $679 million in automotive regulatory credits in the TTM period based on
- $679 million in 1Q22[3]
- $163 million in other income in the TTM period based on
- $56 million income in 1Q22
- $68 million income in 4Q21
- -$6 million expense in 3Q21
- $45 million income in 2Q21
- -$74 million in restructuring and other expense in the TTM period based on
- -$51 million in 3Q21
- -$23 million in 2Q21
Tax Distortion = $0.54/per share, which equals $611 million
This article originally published on June 2, 2022.
Disclosure: David Trainer, Kyle Guske II, and Matt Shuler receive no compensation to write about any specific stock, style, or theme.
Follow us on Twitter, Facebook, LinkedIn, and StockTwits for real-time alerts on all our research.
Appendix I: Core Earnings Methodology
In the Figures above, we use the following to calculate Core Earnings:
While we prefer aggregated quarterly numbers, we have examined the potential impacts of the two methodologies and have found no material differences.
Appendix II: P/E Ratio Methodology for Core & SPGI’s Operating Earnings
In Figure 2 above, we calculate the price-to-Core Earnings ratio through 6/30/13 as follows:
- Calculate a TTM earnings yield for every S&P 500 constituent
- Weight the earnings yields by each stock’s respective S&P 500 weight
- Sum the weighted earnings yields and take the inverse (1/Earnings Yield)
We calculate the price-to-Core Earnings ratio for periods post 6/30/13 as follows:
- Calculate a trailing four quarters earnings yield for every S&P 500 constituent
- Weight the earnings yield by each stock’s respective S&P 500 weight
- Sum the weighted earnings yields and take the inverse (1/Earnings Yield)
We use the earnings yield methodology because P/E ratios don’t follow a linear trend. A P/E ratio of 1 is “better” than a P/E ratio of 30, but a P/E ratio of 30 is “better” than a P/E ratio of -15. In other words, aggregating P/E ratios can result in a low multiple due the inclusion of just a few stocks with negative P/Es.
Using earnings yields solves this problem because a high earnings yield is always “better” than a low earnings yield. There is no conceptual difference when flipping from positive to negative earnings yields as there is with traditional P/E ratios.
By using quarterly data as soon as its available, we better capture the impact of changes to S&P 500 constituents on a quarterly basis. For example, a company could be a constituent in 2Q18, but not in 3Q18. This method captures the continuously changing nature of the S&P 500 constituency.
For all periods in Figure23, we calculate the price-to-SPGI’s Operating Earnings ratio by summing the preceding 4 quarters of Operating Earnings per share and, then, dividing by the S&P 500 price at the end of each measurement period.
[1] Our Core Earnings research is based on the latest audited financial data, which is the calendar 1Q22 10-Q in most cases. Price data as of 5/16/22. Operating Earnings from S&P Global is based on the same time frame.
[2] Our research utilizes our Core Earnings, a more reliable measure of profits, as proven in Core Earnings: New Data & Evidence, written by professors at Harvard Business School (HBS) & MIT Sloan and published in The Journal of Financial Economics.
[3] We treat the automotive regulatory credits as reported items in 1Q22 because they are reported directly on the income statement. In prior quarters, we treat the credits as hidden items as they were disclosed in a table separate from the income statement that disaggregates Tesla’s revenue by source.