
Operating Earnings calculated by S&P Global (SPGI) for the S&P 500 overstate Core Earnings[1],[2] throughout 2021. GAAP Earnings are similarly misleading, as detailed here.
Stocks are more expensive than they appear based on Operating Earnings. Despite falling ~6% in 2022, the S&P 500’s current valuation requires more earnings growth than analysts expect, which increases downside risk for the index.
Last quarter’s analysis of Core vs. Operating Earnings for the S&P 500 is here. All of our research leverages more reliable fundamental data[3] that overcomes flaws with legacy fundamental datasets to provide a more informed view of macro fundamentals and a new source of alpha.
S&P Global’s Earnings Fall and Rebound Are Overstated
Over the past two years, S&P 500 company profits did not decline as much, nor has the rebound been as robust, as SPGI’s Operating Earnings lead investors to believe. For 2021 versus 2020:
- SPGI’s Operating Earnings improved from $122.37/share to $208.07/share, or 70%
- Core Earnings improved from $123.17/share to $197.29/share, or just 60%
- SPGI’s Operating Earnings were 1% below Core Earnings in 2020 and are 5% higher in 2021.
The reason for these differences is that SPGI’s Operating Earnings contain unusual expenses that lead to an exaggerated decline in 2020 and unusual income that lead to an exaggerated rebound in 2021. See Figure 1.
Figure 1: Trailing Twelve Month Earnings: Core Earnings vs. SPGI Operating Earnings: 4Q19 –4Q21[4]
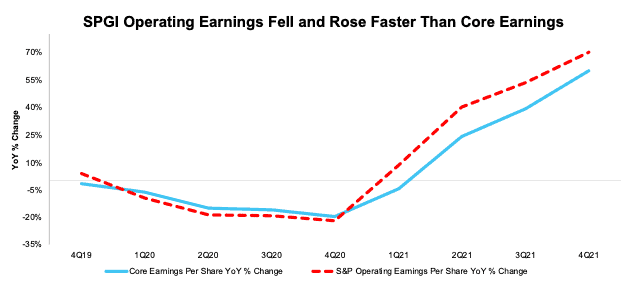
Sources: New Constructs, LLC, company filings, and S&P Global (SPGI). Note: the most recent period’s data for SPGI’s Operating Earnings is based on consensus estimates for companies with a non-standard fiscal year.
More details on the Core Earnings calculation is available in Appendix I.
S&P 500 Is More Expensive than Operating Earnings Imply
At the end of 2021, Core Earnings for the S&P 500 reached new highs, surpassing previous records set in the TTM ended 2Q21 and 3Q21. The bear market that began in 2022 has closed the gap between the S&P 500’s valuation and its true fundamentals, but not as much as many investors think.
As Operating Earnings continue to overstate the S&P 500’s Core Earnings, the index requires continued growth in investor optimism about future profits to support its valuation. We’ve already seen many companies report slowing growth, which has helped drive the market into “correction” territory multiple times this year. As long as investors perceive earnings as higher than they truly are, they are taking more downside risk than they realize.
Figure 2 shows the S&P 500 trailing P/E ratios based on Core Earnings and SPGI’s Operating Earnings have fallen significantly from their peaks in March 2021. Prices have come down relative to earnings since valuations peaked in 2021, but the faster rebound in SPGI’s Operating Earnings results in a lower P/E ratio based on Operating Earnings than when using Core Earnings. The S&P 500 looks inexpensive when valued using Operating Earnings, but that is not the case when the more accurate Core Earnings measure is used.
Figure 2: Price-to-Core vs. Price-to-SPGI’s Operating Earnings: TTM as of 12/31/15 – 3/11/22
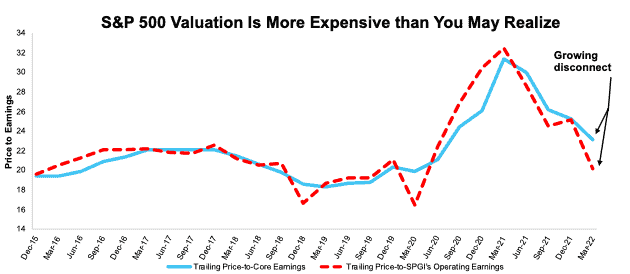
Sources: New Constructs, LLC, company filings, and S&P Global. Note: the most recent period’s data for SPGI’s Operating Earnings incorporates consensus estimates for companies with a non-standard fiscal year.
Our Core Earnings P/E ratio is aggregating the TTM results for constituents through 6/30/13 and aggregating four quarters of results for the S&P 500 constituents in each measurement period thereafter. SPGI’s P/E is based on four quarters of aggregated S&P 500 results in each period. More details in Appendix II.
Core Earnings are a Less Volatile and More Reliable Measure of Earnings
Figure 3 highlights the percentage changes in Core Earnings and SPGI’s Operating Earnings from 2004 to present (through 3/11/22). The difference between the measures is driven by flaws in legacy datasets (detailed in The Journal of Financial Economics) that lead to a failure to capture unusual gains/losses buried in footnotes.
Figure 3: Core vs. SPGI’s Operating Earnings per Share for the S&P 500 – % Change: 2004 – 3/11/22
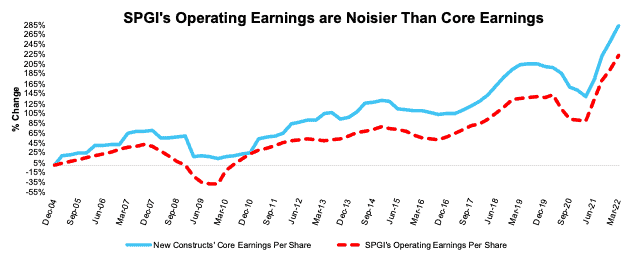
Sources: New Constructs, LLC, company filings, and S&P Global (SPGI). Note: the most recent period’s data for SPGI’s Operating Earnings incorporates consensus estimates for companies with a non-standard fiscal year.
Our Core Earnings analysis is based on aggregated TTM data through 6/30/13, and aggregated quarterly data thereafter for the S&P 500 constituents in each measurement period.
An Example of Overstated Earnings in the S&P 500: American Airlines (AAL)
Below, we detail the hidden and reported unusual items that GAAP Earnings misses but that are captured in Core Earnings for American Airlines (AAL), a stock with some of the most overstated GAAP Earnings in the S&P 500. We would be happy to reconcile our Core Earnings with Operating Earnings if S&P Global would disclose exactly how Operating Earnings differ from GAAP Earnings.
After adjusting for unusual items, we find that American Airline’s 2021 Core Earnings of -$5.4 billion, or -$8.46/share are much worse than reported 2021 GAAP Earnings of -$2.0 billion, or -$3.09/share. American Airline’s Earnings Distortion Score is Strong Miss. Our stock rating for AAL is Unattractive.
Figure 4 details the differences between American Airlines’ Core Earnings and GAAP Earnings.
Figure 4: American Airlines’ GAAP Earnings to Core Earnings Reconciliation: 2021

Sources: New Constructs, LLC and company filings.
More details:
Total Earnings Distortion of $5.36/share, which equals $3.5 billion, is comprised of the following:
Hidden Unusual Gains, Net = $0.84/per share, which equals $538 million and is comprised of
- $539 million in PSP Financial Assistance bundled in Special Items – Page 114
- $28 million in amortization of prior service costs – Page 138
- -$2 million in severance expenses in Special Items – Page 114
- -$27 million in impairment charges related to retiring Embraer 140 fleet – page 107
Reported Unusual Gains Pre-Tax, Net = $6.13/per share, which equals $3.9 billion and is comprised of
- $4.1 billion in mainline operations PSP Financial Assistance
- $293 million in other income
- $19 million in litigation reserve adjustments
- $3 million in mark-to-market adjustments on bankruptcy obligations
- -$10 million in other operating special items
- -$168 million in mainline operations severance expenses
- -$352 million contra adjustment for recurring pension costs. These recurring expenses are reported in non-recurring line items, so we add them back and exclude them from Earnings Distortion.
Tax Distortion = -$1.60/per share, which equals -$1.0 billion
This article originally published on April 8, 2022.
Disclosure: David Trainer, Kyle Guske II, and Matt Shuler receive no compensation to write about any specific stock, style, or theme.
Follow us on Twitter, Facebook, LinkedIn, and StockTwits for real-time alerts on all our research.
Appendix I: Core Earnings Methodology
In the Figures above, we use the following to calculate Core Earnings:
- aggregated annual data for constituents in the S&P 500 for each measurement period through 6/30/13
- aggregated quarterly data for constituents in the S&P 500 for each measurement period post 6/30/13 to the present
While we prefer aggregated quarterly numbers, we have examined the potential impacts of the two methodologies and have found no material differences.
Appendix II: P/E Ratio Methodology for Core & SPGI’s Operating Earnings
In Figure 3 above, we calculate the price-to-Core Earnings ratio through 6/30/13 as follows:
- Calculate a TTM earnings yield for every S&P 500 constituent
- Weight the earnings yields by each stock’s respective S&P 500 weight
- Sum the weighted earnings yields and take the inverse (1/Earnings Yield)
We calculate the price-to-Core Earnings ratio for periods post 6/30/13 as follows:
- Calculate a trailing four quarters earnings yield for every S&P 500 constituent
- Weight the earnings yield by each stock’s respective S&P 500 weight
- Sum the weighted earnings yields and take the inverse (1/Earnings Yield)
We use the earnings yield methodology because P/E ratios don’t follow a linear trend. A P/E ratio of 1 is “better” than a P/E ratio of 30, but a P/E ratio of 30 is “better” than a P/E ratio of -15. In other words, aggregating P/E ratios can result in a low multiple due the inclusion of just a few stocks with negative P/Es.
Using earnings yields solves this problem because a high earnings yield is always “better” than a low earnings yield. There is no conceptual difference when flipping from positive to negative earnings yields as there is with traditional P/E ratios.
By using quarterly data as soon as its available, we better capture the impact of changes to S&P 500 constituents on a quarterly basis. For example, a company could be a constituent in 2Q18, but not in 3Q18. This method captures the continuously changing nature of the S&P 500 constituency.
For all periods in Figure 3, we calculate the price-to-SPGI’s Operating Earnings ratio by summing the preceding 4 quarters of Operating Earnings per share and, then, dividing by the S&P 500 price at the end of each measurement period.
[1] The Journal of Financial Economics features the superiority of our Core Earnings in Core Earnings: New Data & Evidence.
[2] Our Core Earnings research is based on the latest audited financial data, which is the calendar 2021 10-K in most cases. Operating Earnings from S&P Global is based on the same time frame.
[3] Three independent studies prove the superiority of our data, models, and ratings. Learn more here.
[4] 4Q21 refers to financial data for calendar 2021 10-Ks and price data as of 3/11/22 (earliest date for which all the calendar 2021 10-Ks for the S&P 500 constituents were available).