BJ’s Wholesale Club (BJ: $16/share midpoint of IPO price range), a regional warehouse retailer, will IPO on Thursday, June 28. At a price range of $15 to $17 per share, the company plans to raise up to $637 million and has an expected market cap of $2 billion. At the midpoint of its price range, BJ currently earns our Neutral rating.
BJ’s operates under a similar model as Costco (COST). The company sells its products at cost and earns substantially all of its profits from membership fees. The company, which operates primarily in New York and New England, was taken private in a leveraged buyout in 2011 and has paid out nearly $2 billion in dividends to its private owners since then.
Is this IPO an opportunity for investors to get back in on a great business, or is it an attempt by the private equity owners to cash out and leave the public holding the bag? We dig into its filings to help investors find the answers.
GAAP Earnings Understate Profitability
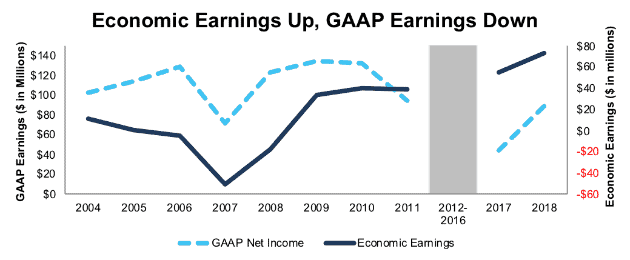
Reported earnings make BJ appear less profitable than it was prior to being taken private. The company reported GAAP net income of $89 million in fiscal year 2018 (which ended on February 2), 7% below its $95 million GAAP net income in 2011.
However, the company’s economic earnings – the real cash flows of the business – are up 84% over the same timeframe. Figure 1 has details.
Figure 1: BJ’s Economic and GAAP Earnings Since 2004
Sources: New Constructs, LLC and company filings
BJ’s $73 million in economic earnings in 2018 were the highest we’ve recorded in our model going back to 1998. The disconnect between GAAP net income and economic earnings comes from two primary sources.
First, GAAP earnings in 2018 were artificially diminished due to $46 million (1% of revenue) in hidden non-operating expenses.
Second, the company’s capital structure has shifted to a much more debt-heavy model. In 2011, BJ’s market cap accounted for 55% of its enterprise value while debt accounted for 45%. At the midpoint of its proposed IPO range, BJ’s market cap will account for just 27% of its enterprise value while debt (including $2.5 billion in off-balance sheet debt) will account for 63%.
This change in the capital structure is important because GAAP earnings account for the cost of debt (interest) but not the cost of equity, while economic earnings account for both. The additional debt the company has taken on since 2011 hasn’t decreased the profitability of its operations, but it does decrease accounting earnings.
Debt Decreases Value to Shareholders
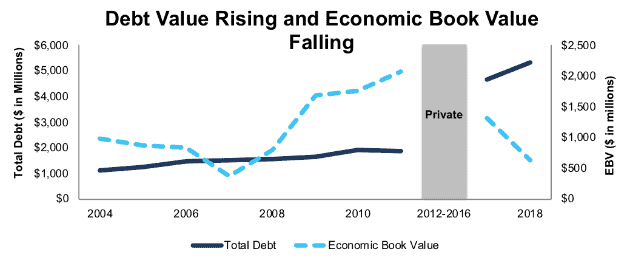
While increased debt doesn’t decrease the cash flows of the operations, it does increase the amount of preference that other stakeholders have over shareholders. Figure 2 compares BJ’s debt over time to its economic book value (EBV), the value of the company to shareholders assuming zero growth in cash flows.
Figure 2: BJ Debt and EBV Since 2004
Sources: New Constructs, LLC and company filings
By taking on debt to acquire the company and pay themselves dividends, BJ’s private equity investors have made the company significantly less valuable to shareholders.
Public Shareholders Have Few Rights
BJ doesn’t have a dual-class share structure like we’ve seen with many other recent IPOs, but public shareholders will still have very little power. Even after the IPO, its private equity owners will retain a 69% stake that gives them a majority on all shareholder votes.
Even though the private equity owners have paid themselves nearly $2 billion in dividends since 2011, public shareholders won’t be eligible to receive any cash payments. The debt BJ took on to pay those dividends carried covenants that restricted any further dividend payments in the future.
Middle of the Road in Profits and Valuation
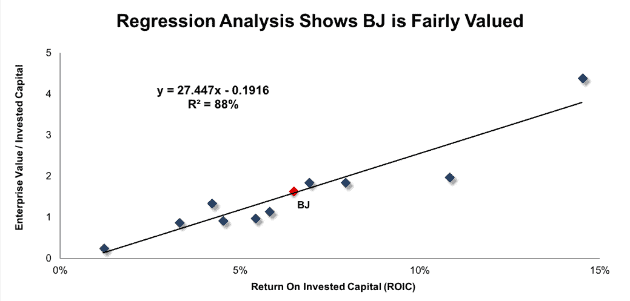
Aside from its high level of debt, BJ looks similar to other supermarkets in terms of both profitability and valuation. Figure 3 shows that return on invested capital (ROIC) drives 88% of the difference in valuation for the 11 supermarket chains we cover. At the midpoint of its proposed offering range, BJ ranks right at the average for both ROIC and enterprise value/invested capital (a cleaner version of price to book).
Figure 3: ROIC Explains 88% of Valuation for Supermarket Chains
Sources: New Constructs, LLC and company filings
Based on its position on the trendline, BJ’s enterprise value/invested capital of 1.6 is exactly what we’d expected for its ROIC of 6.5%.
Our Discounted Cash Flow Model Reveals BJ Is Fairly Valued
The growth expectations implied by BJ’s proposed IPO valuation are reasonable. To justify a valuation of $16/share, BJ must grow after-tax operating profit (NOPAT) by 6% compounded annually for five years. With tax cuts providing a significant portion of that profit growth, BJ only needs to maintain pre-tax margins and grow revenue by 3% compounded annually in this scenario. See the math behind this dynamic DCF scenario here.
One consequence of BJ’s high leverage is that small changes in growth projections can have a major impact on valuation. If we use the same margin assumptions as above but project revenue to decline by 1% a year for five years, BJ is worth just $3.50/share today, 78% below the midpoint of the IPO range. See the math behind this dynamic DCF scenario here.
Overall, BJ is a fine business, but the high level of debt creates risk for investors that is not worth taking. Investors that want exposure to this sector should look at companies below the trendline in Figure 3, such as Walmart (WMT), which is in our Focus List – Long Model Portfolio.
Critical Details Found in Financial Filings By Our Robo-Analyst Technology
As investors focus more on fundamental research, research automation technology is needed to analyze all the critical financial details in financial filings. Below are specifics on the adjustments we make based on Robo-Analyst[1] findings in BJ’s S-1:
Income Statement: we made $415 million of adjustments, with a net effect of removing $213 million in non-operating expense (2% of revenue). You can see all the adjustments made to BJ’s income statement here.
Balance Sheet: we made $2.8 billion of adjustments to calculate invested capital with a net increase of $2.8 billion. The largest adjustments was $2.5 billion in operating leases. This adjustment represented 139% of reported net assets. You can see all the adjustments made to BJ’s balance sheet here.
Valuation: we made $5.5 billion of adjustments with a net effect of decreasing shareholder value by $5.5 billion. Outside of the debt mentioned above, the largest adjustment to shareholder value was $78 million in outstanding employee stock options. This option adjustment represents 4% of BJ’s proposed market cap.
This article originally published on June 26, 2018.
Disclosure: David Trainer, Kyle Guske II, and Sam McBride receive no compensation to write about any specific stock, style, or theme.
Follow us on Twitter, Facebook, LinkedIn, and StockTwits for real-time alerts on all our research.
[1] Harvard Business School features the powerful impact of our research automation technology in the case New Constructs: Disrupting Fundamental Analysis with Robo-Analysts.


