
This report is an abridged and free version of S&P 500 & Sectors: ROIC vs. WACC Through 2Q21, one of the reports in our quarterly series on fundamental market and sector trends, which is available to Pro and higher members. More free reports on the fundamental trends for the overall market and each sector are available here.
The full version of the report analyzes the drivers[1] of economic earnings [return on invested capital (ROIC), NOPAT margin, invested capital turns, and weighted average cost of capital (WACC)] for the S&P 500 and each of its sectors (last quarter’s analysis is here). Our research is based on the latest audited financial data, which is the calendar 2Q21 10-Q for most companies. Price data is as of 8/18/21.
These reports leverage more reliable fundamental data[2] that overcomes flaws with legacy fundamental datasets. Investors armed with our research enjoy a more informed view of the fundamentals and valuations of companies and sectors. Investors armed with our Core Earnings data feed enjoy idiosyncratic alpha.
S&P 500 ROIC Continues to Rebound in 2Q21
After the COVID-19 pandemic caused ROIC to fall throughout 2020, the S&P 500’s ROIC sharply recovered in 1H21 to pre-pandemic levels. Figure 1 shows the S&P 500’s ROIC rose from 7.4% in 2Q20 to 8.6% in 2Q21. The S&P 500’s NOPAT margin rose from 10.8% in 2Q20 to 11.9% in 2Q21, while invested capital turns rose from 0.69 to 0.72 over the same time.
Figure 1: ROIC and WACC for the S&P 500 From December 2004 – 8/18/21[3]
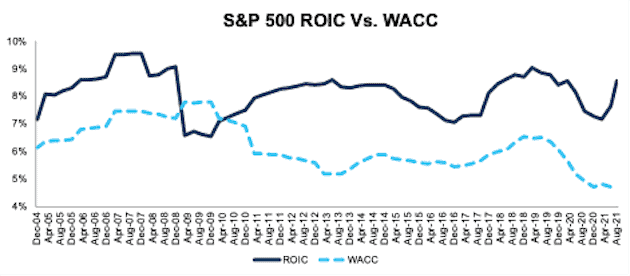
Sources: New Constructs, LLC and company filings.
The August 18, 2021 measurement period uses price data as of that date and incorporates the financial data from 2Q21 10-Qs, as this is the earliest date for which all the 2Q21 10-Qs for the S&P 500 constituents were available.
Key Details on Select S&P 500 Sectors
Nine of eleven S&P 500 sectors saw an improvement in ROIC year-over-year (YoY) based on 2Q21 financial data.
The Technology sector performed best over the past year, with its ROIC rising over 630 basis points. This trend is not surprising given that the global COVID-19 shutdowns accelerated the enterprise and individual shift to cloud and other software solutions.
On the flip side, the Industrials and Financials sectors have the largest drop in ROIC YoY.
Overall, the Technology sector earns the highest ROIC of all sectors, by far, and the Energy sector earns the lowest ROIC. Below, we highlight the Consumer Non-cyclicals sector.
Sample Sector Analysis[4]: Consumer Non-cyclicals
Figure 2 shows the Consumer Non-Cyclicals sector ROIC rose from 8.6% in 2Q20 to 9.5% in 2Q21. The Consumer Non-cyclicals sector NOPAT margin rose from 6.2% in 2Q20 to 6.8% in 2Q21, while invested capital turns rose from 1.38 to 1.41 over the same time.
Figure 2: Consumer Non-cyclicals ROIC vs. WACC: December 2004 – 8/18/21
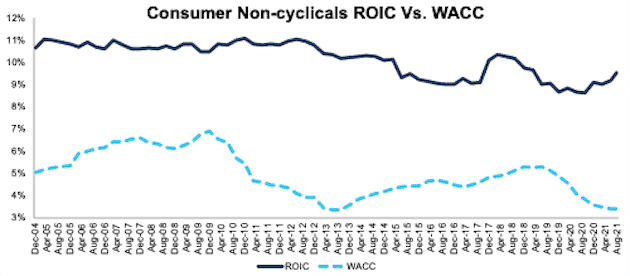
Sources: New Constructs, LLC and company filings.
The August 18, 2021 measurement period uses price data as of that date and incorporates the financial data from 2Q21 10-Qs, as this is the earliest date for which all the 2Q21 10-Qs for the S&P 500 constituents were available.
Figure 3 compares the NOPAT margin and invested capital turns trends for the Consumer Non-cyclicals sector since 2004. We sum the individual S&P 500 constituent values for revenue, NOPAT, and invested capital to calculate these metrics. We call this approach the “Aggregate” methodology.
Figure 3: Consumer Non-Cyclicals NOPAT Margin and IC Turns: December 2004 – 8/18/21
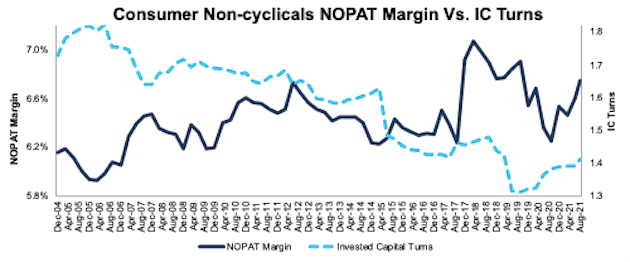
Sources: New Constructs, LLC and company filings.
The August 18, 2021 measurement period uses price data as of that date and incorporates the financial data from 2Q21 10-Qs, as this is the earliest date for which all the 2Q21 10-Qs for the S&P 500 constituents were available.
The Aggregate methodology provides a straightforward look at the entire sector, regardless of market cap or index weighting and matches how S&P Global (SPGI) calculates metrics for the S&P 500.
For additional perspective, we compare the Aggregate method for ROIC with two other market-weighted methodologies: market-weighted metrics and market-weighted drivers. Each method has its pros and cons, which are detailed in the Appendix.
Figure 4 compares these three methods for calculating the Consumer Non-cyclicals sector ROIC.
Note the impact on the market-weighted metrics version of ROIC for the Consumer Non-cyclicals sector from Lorillard (LO) in 2013, when the firm’s ROIC was more than 36,000%.This outlier caused the Consumer Non-cyclicals sector’s ROIC to increase from 15% to 334% in just one period, before falling to 24% one period later.
Figure 4: Consumer Non-cyclicals ROIC Methodologies Compared: December 2004 – 8/18/21
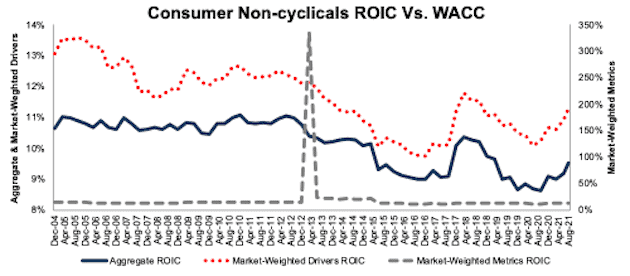
Sources: New Constructs, LLC and company filings.
The August 18, 2021 measurement period uses price data as of that date and incorporates the financial data from 2Q21 10-Qs, as this is the earliest date for which all the 2Q21 10-Qs for the S&P 500 constituents were available.
This article originally published on August 26, 2021.
Disclosure: David Trainer, Kyle Guske II, Alex Sword, and Matt Shuler receive no compensation to write about any specific stock, style, or theme.
Follow us on Twitter, Facebook, LinkedIn, and StockTwits for real-time alerts on all our research.
Appendix: Analyzing ROIC with Different Weighting Methodologies
We derive the metrics above by summing the individual S&P 500 constituent values for revenue, NOPAT, and invested capital to calculate the metrics presented. We call this approach the “Aggregate” methodology.
The Aggregate methodology provides a straightforward look at the entire sector, regardless of market cap or index weighting and matches how S&P Global (SPGI) calculates metrics for the S&P 500.
For additional perspective, we compare the Aggregate method for ROIC with two other market-weighted methodologies:
- Market-weighted metrics – calculated by market-cap-weighting the ROIC for the individual companies relative to their sector or the overall S&P 500 in each period. Details:
- Company weight equals the company’s market cap divided by the market cap of the S&P 500/its sector
- We multiply each company’s ROIC by its weight
- S&P 500/Sector ROIC equals the sum of the weighted ROICs for all the companies in the S&P 500/each sector
- Market-weighted drivers – calculated by market-cap-weighting the NOPAT and invested capital for the individual companies in each sector in each period. Details:
- Company weight equals the company’s market cap divided by the market cap of the S&P 500/its sector
- We multiply each company’s NOPAT and invested capital by its weight
- We sum the weighted NOPAT and invested capital for each company in the S&P 500/each sector to determine each sector’s weighted NOPAT and weighted invested capital
- S&P 500/Sector ROIC equals weighted sector NOPAT divided by weighted sector invested capital
Each methodology has its pros and cons, as outlined below:
Aggregate method
Pros:
- A straightforward look at the entire S&P 500/sector, regardless of company size or weighting in any indices.
- Matches how S&P Global calculates metrics for the S&P 500.
Cons:
- Vulnerable to impact of by companies entering/exiting the group of companies, which could unduly affect aggregate values despite the level of change from companies that remain in the group.
Market-weighted metrics method
Pros:
- Accounts for a firm’s size relative to the overall S&P 500/sector and weights its metrics accordingly.
Cons:
- Vulnerable to outsized impact of one or a few companies, as shown below in the Consumer Non-cyclicals sector. This outsized impact tends to occur only for ratios where unusually small denominator values can create extremely high or low results.
Market-weighted drivers method
Pros:
- Accounts for a firm’s size relative to the overall S&P 500/sector and weights its NOPAT and invested capital accordingly.
- Mitigates potential outsized impact of one or a few companies by aggregating values that drive the ratio before calculating the ratio.
Cons:
- Can minimize the impact of period-over-period changes in smaller companies, as their impact on the overall sector NOPAT and invested capital is smaller.
[1] We calculate these metrics based on SPGI’s methodology, which sums the individual S&P 500 constituent values for NOPAT and invested capital before using them to calculate the metrics. We call this the “Aggregate” methodology. Get more details in the Appendix.
[2] For 3rd-party reviews, including The Journal of Financial Economics, on our more reliable fundamental data and research click here and here.
[3] We use stock prices from 8/18/21 because that is the date when all the 2Q21 10-Qs for the S&P 500 constituents were available.
[4] The full version of this report provides analysis for every sector like what we show for this sector.