
We hope you enjoy this free research on this month’s featured stock for our Dividend Growth Model Portfolio.
The idea behind featuring stocks and sharing research with you is to give you free insights into the uniquely high value-add of our research. We want you to know how we do research, so you know what reliable research looks like. While we’re not giving away the name of the stock, we are giving away our rigorous research techniques.
Today’s feature provides a summary of how we pick stocks for this Model Portfolio. This summary is not a full Long Idea report, but it gives you insight into the rigor of our research and approach to picking stocks. Whether you’re a subscriber or not, we think it is important that you’re able to see our research on stocks on a regular basis. We’re proud to share our work.
Our write-up is below. We hope you enjoy it. We hope you find value.
As David shared in a recent training, dividends provide a safe haven in a volatile market, and the stocks in this Model Portfolio have great potential for dividend growth in the future.
We update this Model Portfolio monthly. September’s Dividend Growth Model Portfolio was updated and published for clients on September 25, 2024.
Recap from August’s Picks
The best performing stock was up 7%. Overall, 8 out of the 25 Dividend Growth Stocks outperformed their benchmark (S&P 500) from August 29, 2024 through September 25, 2024.
This report leverages our cutting-edge Robo-Analyst technology to deliver proven-superior fundamental research and support more cost-effective fulfillment of the fiduciary duty of care.
This Model Portfolio mimics an “All Cap Blend” style with a focus on dividend growth. Selected stocks earn an Attractive or Very Attractive rating, generate positive free cash flow (FCF) and economic earnings, offer a current dividend yield >1%, and have a 5+ year track record of consecutive dividend growth. This Model Portfolio is designed for investors who favor long-term capital appreciation over current income, but still appreciate the power of growing dividends.
Featured Stock for September: Basic Materials Company
This company has grown revenue and Core Earnings by 9% and 24% compounded annually, respectively, over the past decade. The company’s NOPAT margin increased from 3% in 2013 to 11% in the TTM, while invested capital turns rose from 1.4 to 1.5 over the same time. Rising NOPAT margins and invested capital turns drive return on invested capital (ROIC) from 5% in 2013 to 16% in the TTM.
Figure 1: Revenue & Core Earnings Since 2013
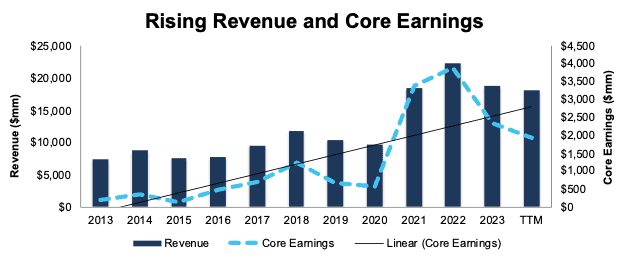
Sources: New Constructs, LLC and company filings
Free Cash Flow Supports Regular Dividend Payments
This company has increased its regular, quarterly dividend from $0.19/share in 2Q18 to $0.46/share in 3Q24. The quarterly dividend, when annualized, equals $1.84/share and provides a 1.4% dividend yield.
More importantly, the company’s cumulative free cash flow (FCF) easily exceeds its dividend payments. From 2018 through 2Q24, the company generated $7.4 billion (33% of current enterprise value) in FCF while paying $1.4 billion in dividends. See Figure 2.
Figure 2: FCF vs. Dividends Since 2018
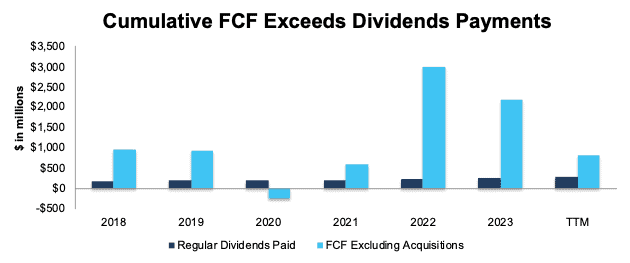
Sources: New Constructs, LLC and company filings
Companies with FCF well above dividend payments provide higher-quality dividend growth opportunities. On the other hand, dividends that exceed FCF cannot be trusted to grow or even be maintained.
This Stock Is Undervalued
At its current price of $130/share, this stock has a price-to-economic book value (PEBV) ratio of 1.0. This ratio means the market expects the company’s NOPAT to never grow from current levels. This expectation seems overly pessimistic given that the company has grown NOPAT by 8% and 21% over the past five and ten years, respectively.
Even if the company’s NOPAT margin falls to 10% (below five-year average of 13% and TTM margin of 11%) and revenue grows just 4% (compared to 9% compounded annually over the last decade) compounded annually for the next decade, the stock would be worth $158/share today – a 22% upside. In this scenario, the company’s NOPAT would grow only 1% compounded annually through 2033.
Add in the company’s 1.4% dividend yield and a history of dividend growth, and it’s clear why this stock is in September’s Dividend Growth Stocks Model Portfolio.
Critical Details Found in Financial Filings by Our Robo-Analyst Technology
Below are specifics on the adjustments we make based on Robo-Analyst findings in this featured stock’s 10-K and 10-Q:
Income Statement: we made over $260 million in adjustments with a net effect of removing over $20 million in non-operating income. Clients can see all adjustments made to the company’s income statement on the GAAP Reconciliation tab on the Ratings page on our website.
Balance Sheet: we made just under $2.9 billion in adjustments to calculate invested capital with a net decrease of just under $900 million. The most notable adjustment was for asset write downs. See all adjustments made to the company’s balance sheet on the GAAP Reconciliation tab on the Ratings page on our website.
Valuation: we made over $4.6 billion in adjustments, with a net effect of decreasing shareholder value by over $2.8 billion. Apart from total debt, the most notable adjustment to shareholder value was for deferred tax liabilities. See all adjustments to the company’s valuation on the GAAP Reconciliation tab on the Ratings page on our website.
….there’s much more in the full report. You can start your membership here to get access to this report and much more.